 3
3peptides
spectra
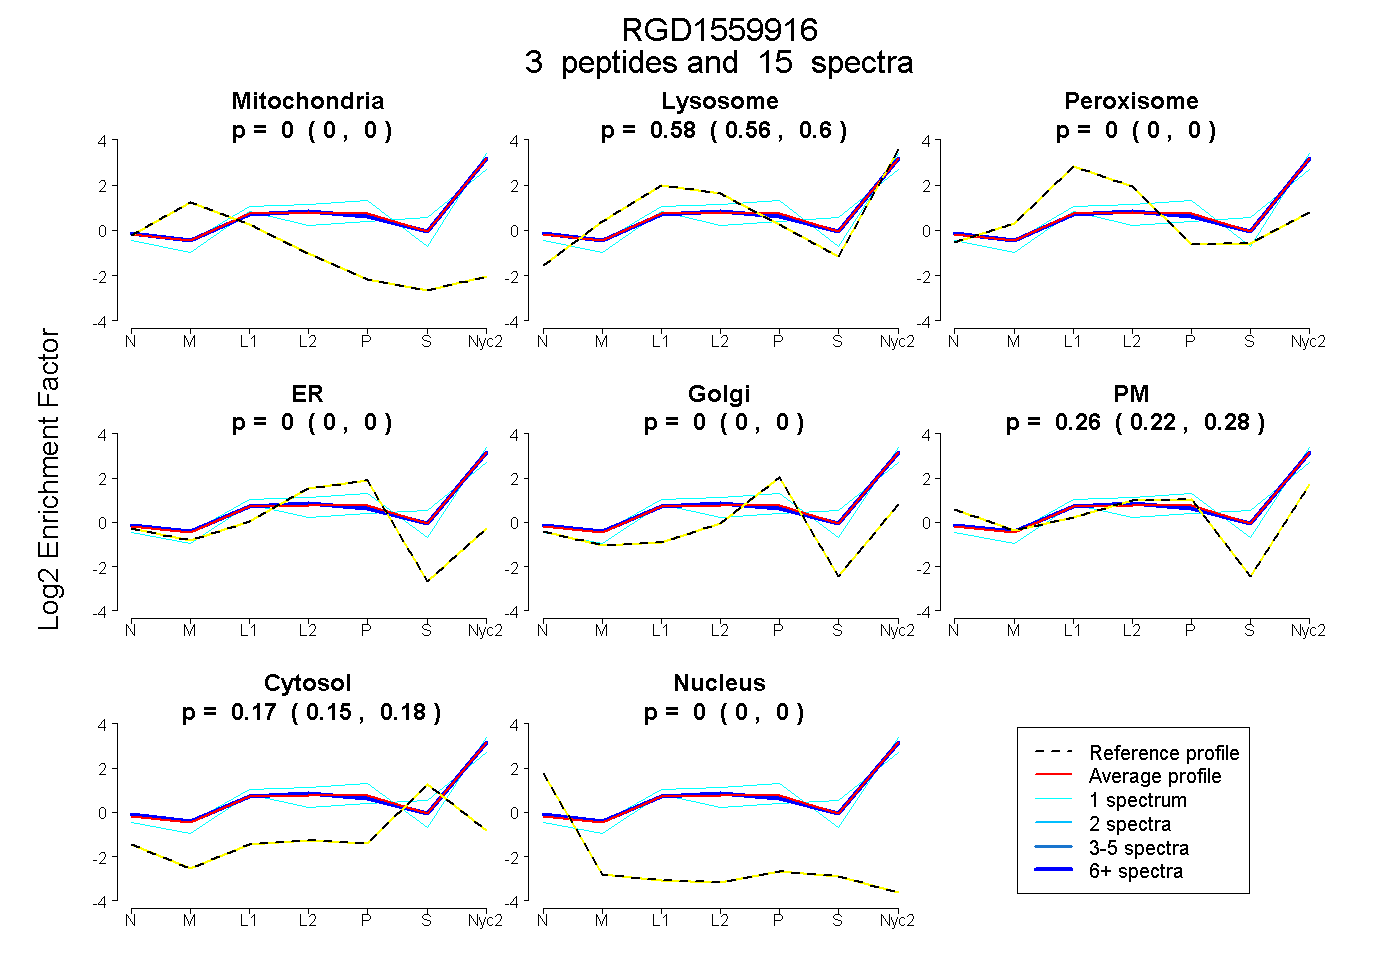
0.000 | 0.000
0.559 | 0.597
0.000 | 0.000
0.000 | 0.000
0.000 | 0.000
0.220 | 0.283
0.148 | 0.180
0.000 | 0.000
4peptides
spectra
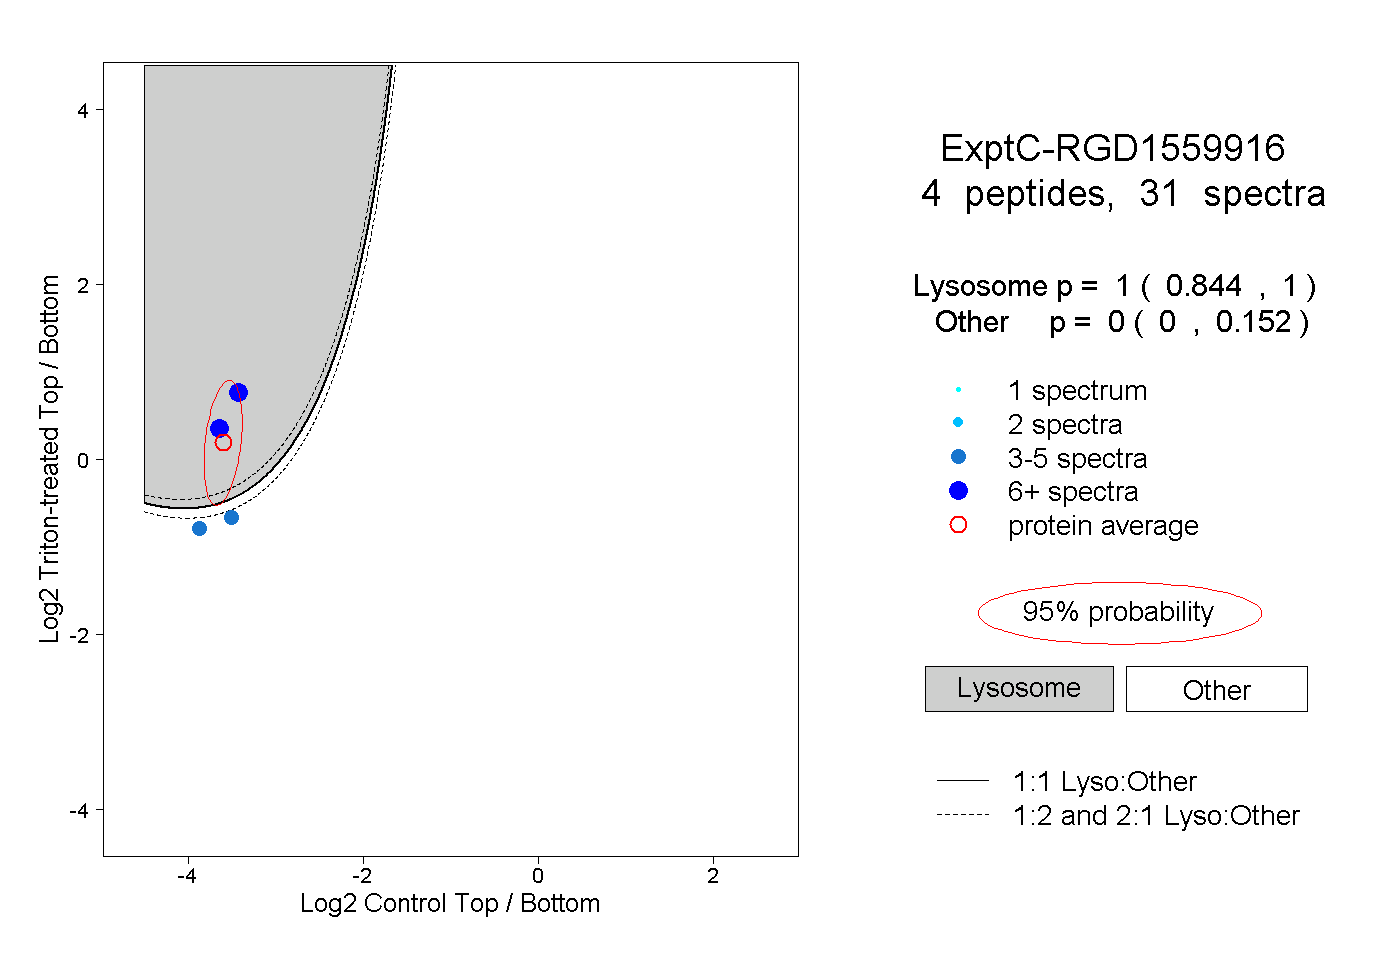
0.844 | 1.000
0.000 | 0.152
1peptide
spectra
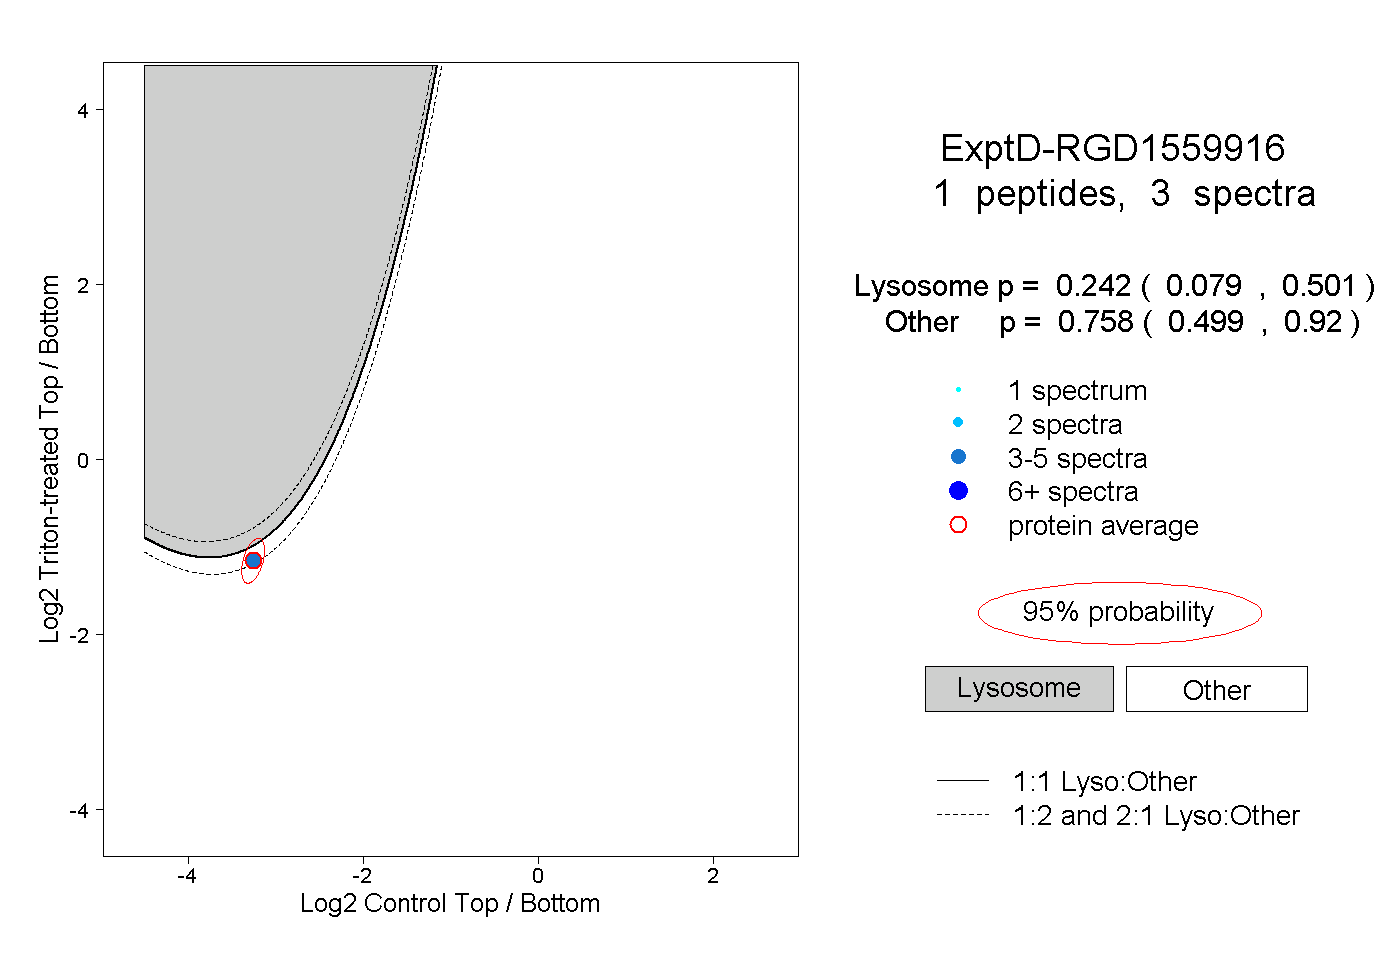
0.079 | 0.501
0.499 | 0.920