 3
3peptides
spectra
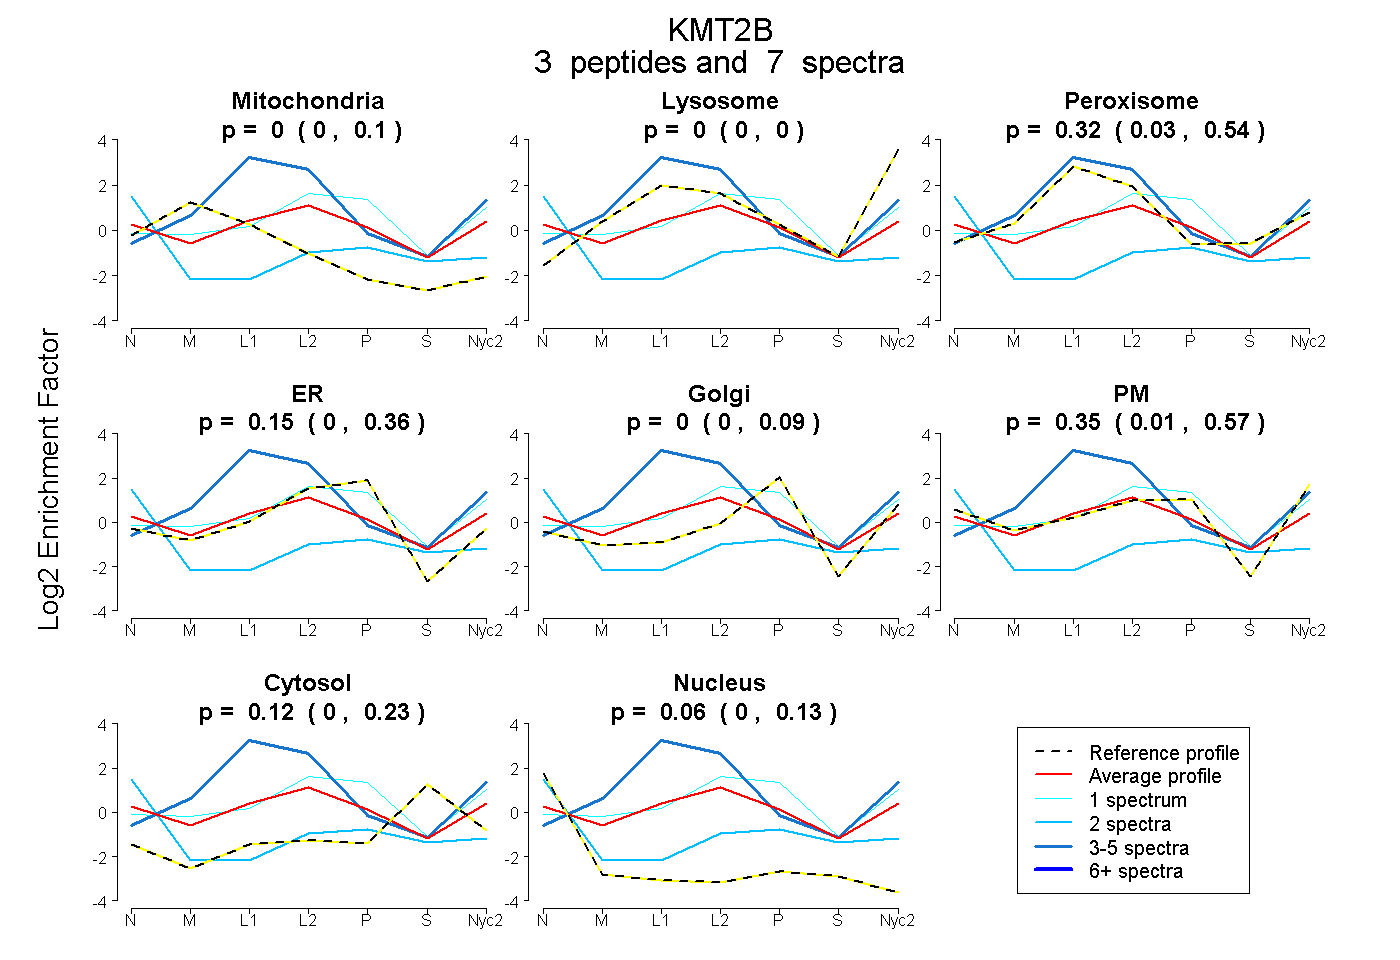
0.000 | 0.097
0.000 | 0.000
0.029 | 0.539
0.000 | 0.356
0.000 | 0.094
0.007 | 0.572
0.000 | 0.231
0.000 | 0.127
2peptides
spectra
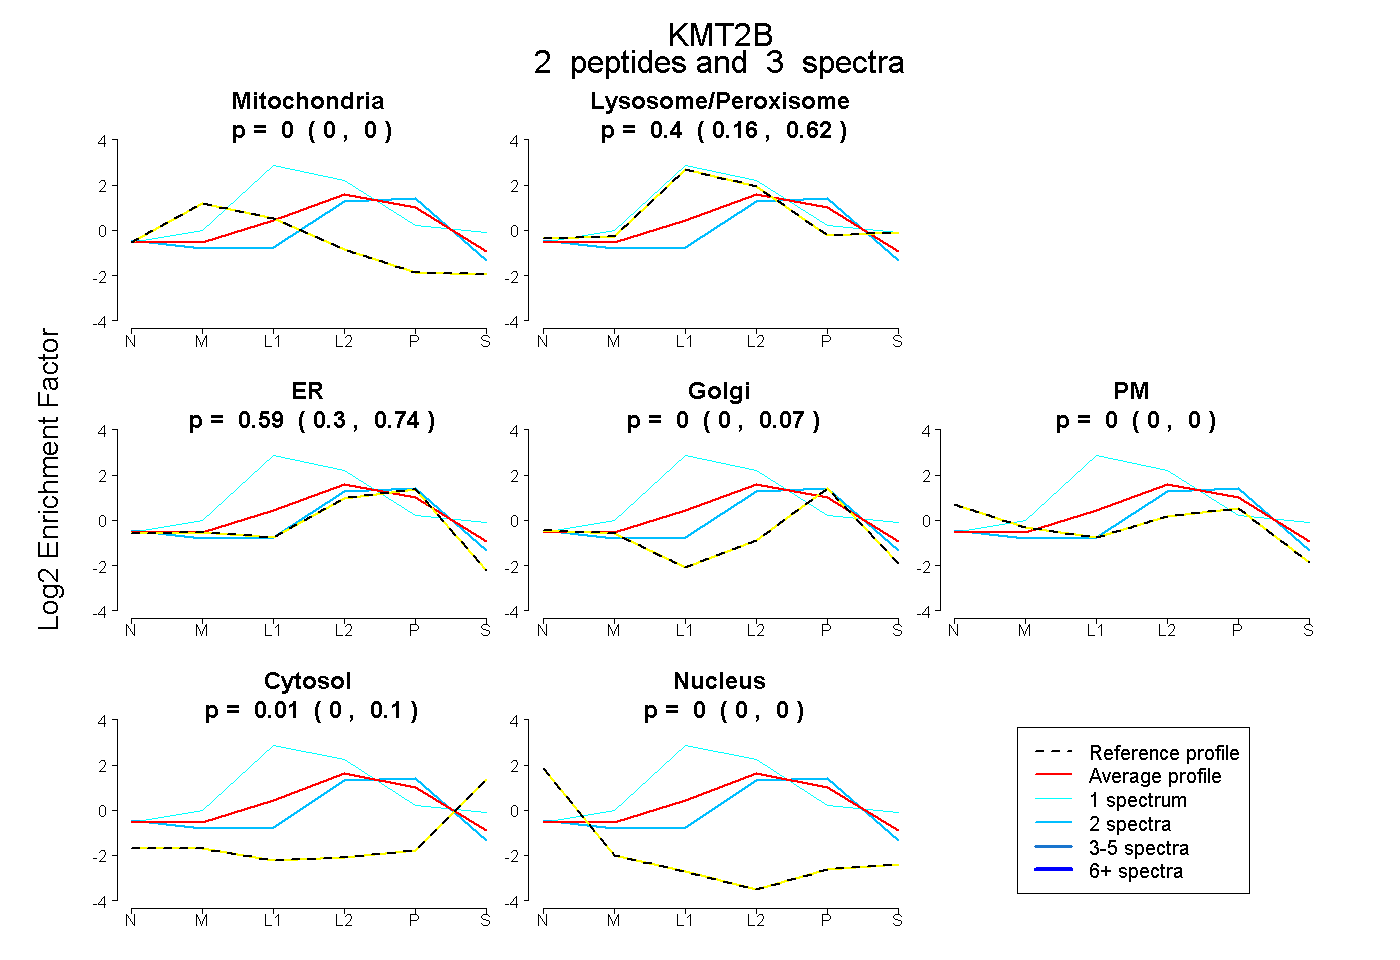
0.000 | 0.000
0.159 | 0.619
0.301 | 0.744
0.000 | 0.067
0.000 | 0.000
0.000 | 0.099
0.000 | 0.000