 17
17peptides
spectra
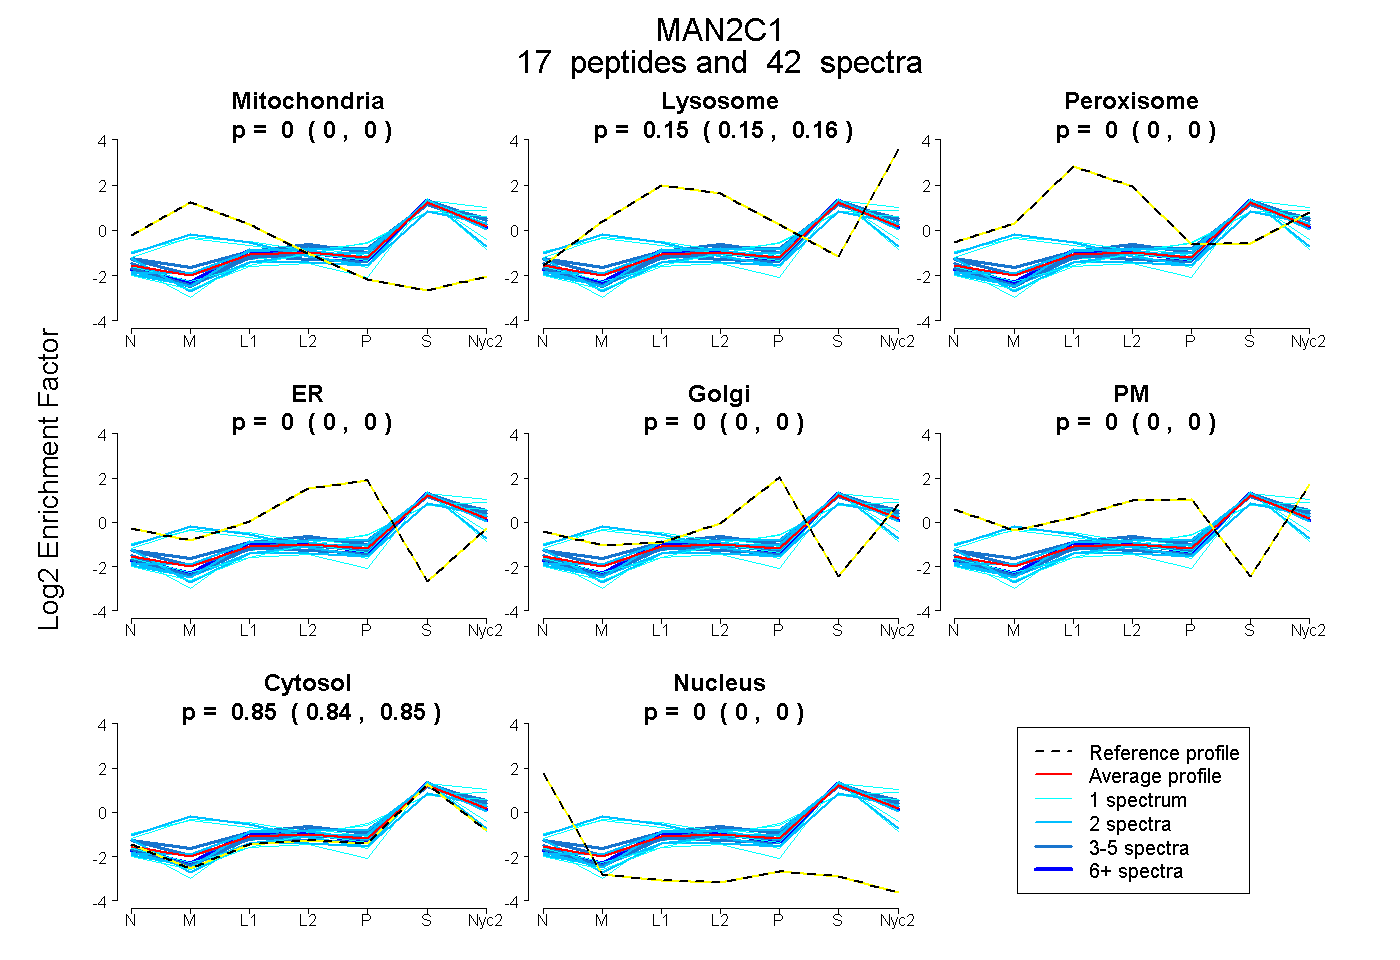
0.000 | 0.000
0.148 | 0.156
0.000 | 0.000
0.000 | 0.000
0.000 | 0.000
0.000 | 0.000
0.844 | 0.852
0.000 | 0.000
7peptides
spectra
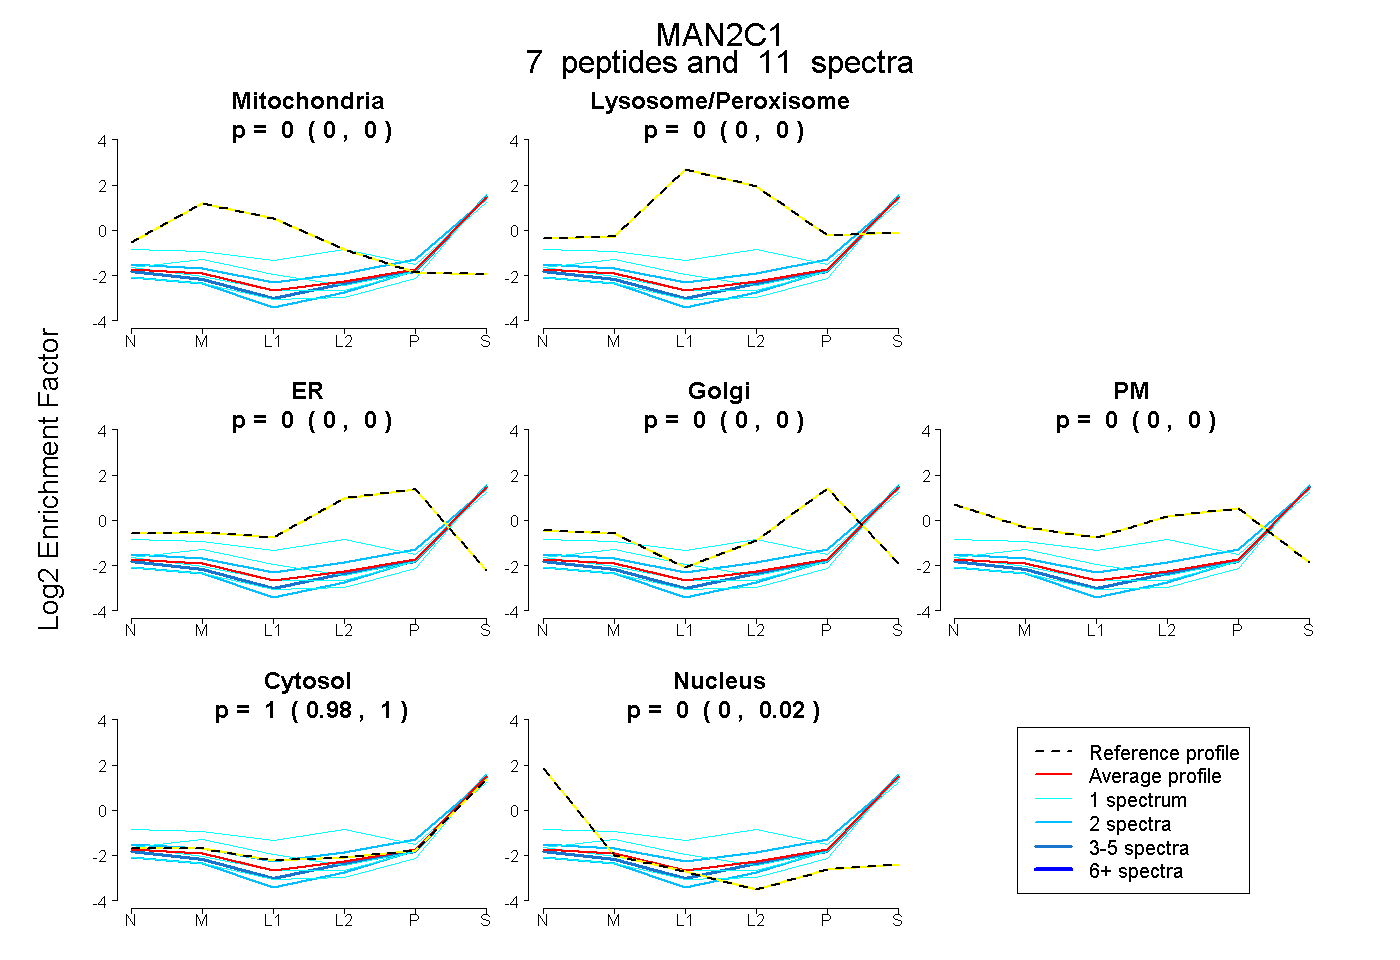
0.000 | 0.000
0.000 | 0.000
0.000 | 0.000
0.000 | 0.000
0.000 | 0.000
0.982 | 1.000
0.000 | 0.016
13peptides
spectra
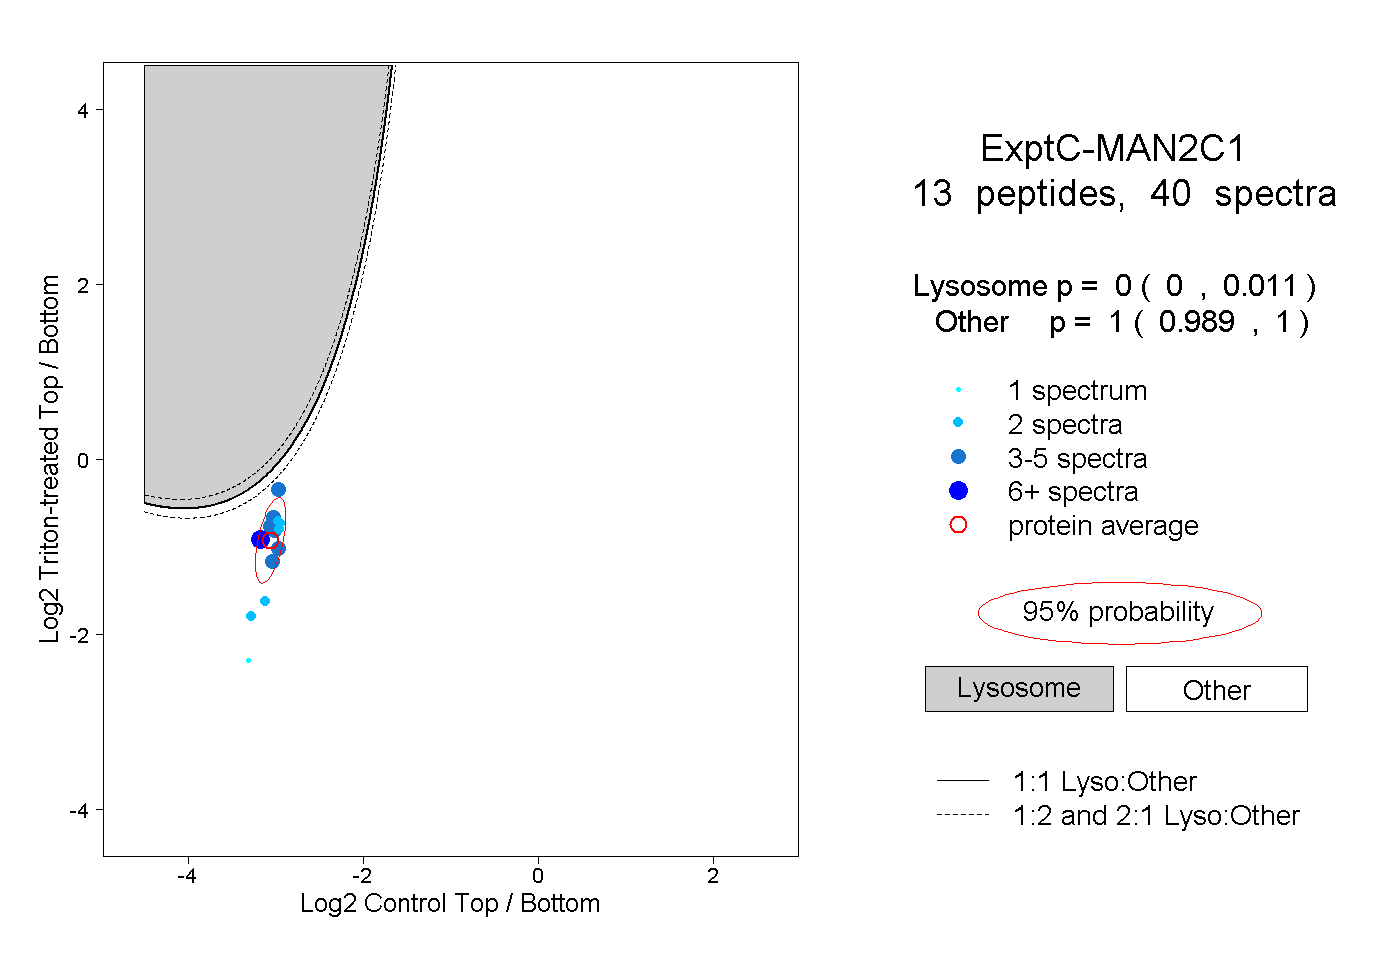
0.000 | 0.011
0.989 | 1.000
1peptide
spectrum
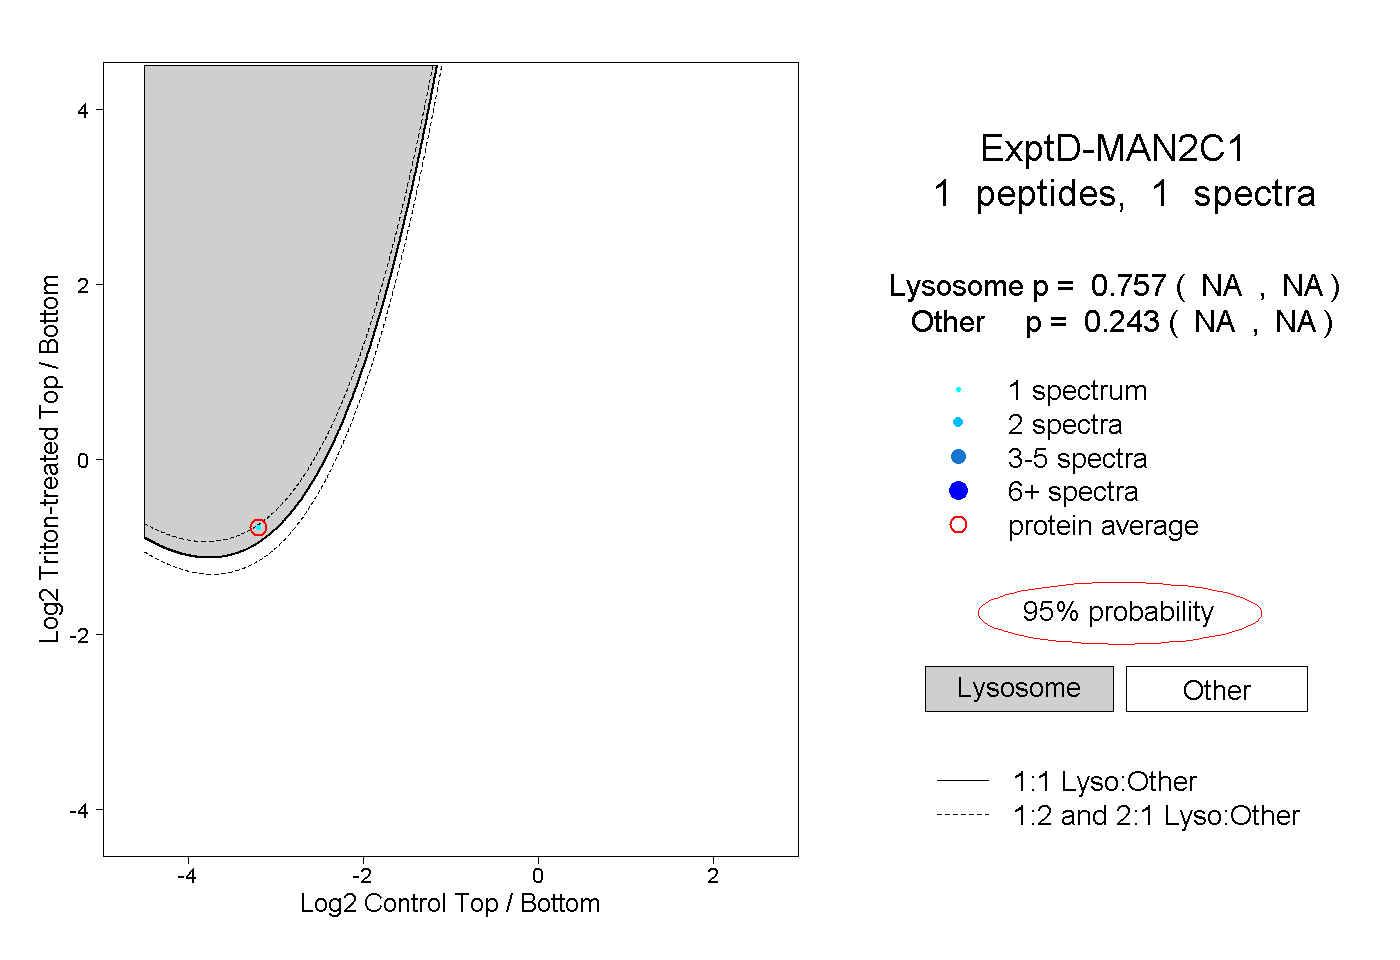
NA | NA
NA | NA