 17
17peptides
spectra
0.000 | 0.000
0.148 | 0.156
0.000 | 0.000
0.000 | 0.000
0.000 | 0.000
0.000 | 0.000
0.844 | 0.852
0.000 | 0.000
| Plot | Mito | Lyso | Perox | ER | Golgi | PM | Cytosol | Nucleus | |||||
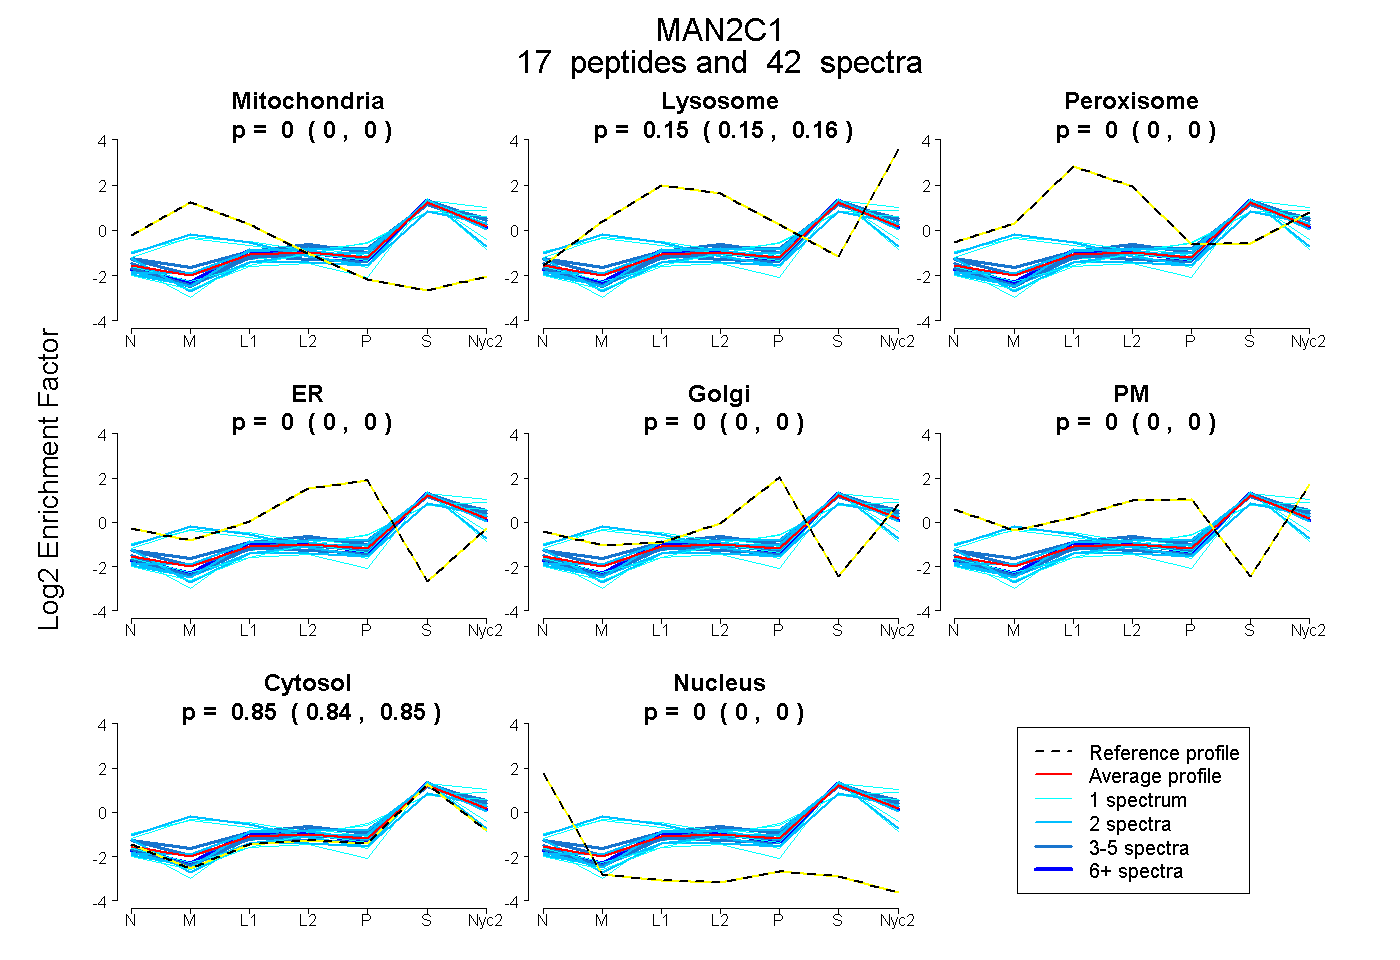
| Expt A |
17 peptides |
42 spectra |
|
0.000 0.000 | 0.000 |
0.152 0.148 | 0.156 |
0.000 0.000 | 0.000 |
0.000 0.000 | 0.000 |
0.000 0.000 | 0.000 |
0.000 0.000 | 0.000 |
0.848 0.844 | 0.852 |
0.000 0.000 | 0.000 |
| 2 spectra, TSYVLSER | 0.000 | 0.066 | 0.000 | 0.000 | 0.028 | 0.000 | 0.906 | 0.000 | ||
| 2 spectra, VEFPAR | 0.000 | 0.138 | 0.000 | 0.000 | 0.000 | 0.000 | 0.862 | 0.000 | ||
| 1 spectrum, TVTNNR | 0.000 | 0.105 | 0.000 | 0.000 | 0.000 | 0.000 | 0.895 | 0.000 | ||
| 4 spectra, LGNTDGLPR | 0.000 | 0.190 | 0.000 | 0.000 | 0.007 | 0.000 | 0.803 | 0.000 | ||
| 5 spectra, LTFSPFQVR | 0.000 | 0.134 | 0.000 | 0.000 | 0.000 | 0.000 | 0.866 | 0.000 | ||
| 1 spectrum, APDVTADMGR | 0.000 | 0.176 | 0.000 | 0.000 | 0.000 | 0.000 | 0.824 | 0.000 | ||
| 4 spectra, GLGEDNQR | 0.000 | 0.119 | 0.000 | 0.000 | 0.000 | 0.000 | 0.881 | 0.000 | ||
| 3 spectra, HEFTYALMPHK | 0.000 | 0.211 | 0.000 | 0.000 | 0.000 | 0.000 | 0.789 | 0.000 | ||
| 1 spectrum, SWSTAVK | 0.065 | 0.344 | 0.000 | 0.000 | 0.000 | 0.000 | 0.590 | 0.000 | ||
| 1 spectrum, VELVIPEVWVGK | 0.000 | 0.000 | 0.000 | 0.000 | 0.000 | 0.000 | 1.000 | 0.000 | ||
| 2 spectra, YGTSVR | 0.196 | 0.214 | 0.000 | 0.000 | 0.000 | 0.000 | 0.590 | 0.000 | ||
| 2 spectra, YEVWAHR | 0.000 | 0.187 | 0.000 | 0.000 | 0.000 | 0.000 | 0.813 | 0.000 | ||
| 7 spectra, LAVFHR | 0.000 | 0.135 | 0.000 | 0.000 | 0.000 | 0.000 | 0.865 | 0.000 | ||
| 1 spectrum, SAQFLYPAVQLQR | 0.098 | 0.271 | 0.000 | 0.000 | 0.040 | 0.000 | 0.591 | 0.000 | ||
| 3 spectra, GNVLSLSLLR | 0.000 | 0.094 | 0.000 | 0.000 | 0.000 | 0.000 | 0.906 | 0.000 | ||
| 2 spectra, FVSPIYFTDCNLR | 0.000 | 0.002 | 0.000 | 0.000 | 0.000 | 0.000 | 0.998 | 0.000 | ||
| 1 spectrum, ECEQILHDVELLSSLALAR | 0.007 | 0.070 | 0.000 | 0.000 | 0.000 | 0.000 | 0.923 | 0.000 |
| Plot | Mito | Lyso or Perox | ER | Golgi | PM | Cytosol | Nucleus | ||||||
| Expt B |
7 peptides |
11 spectra |
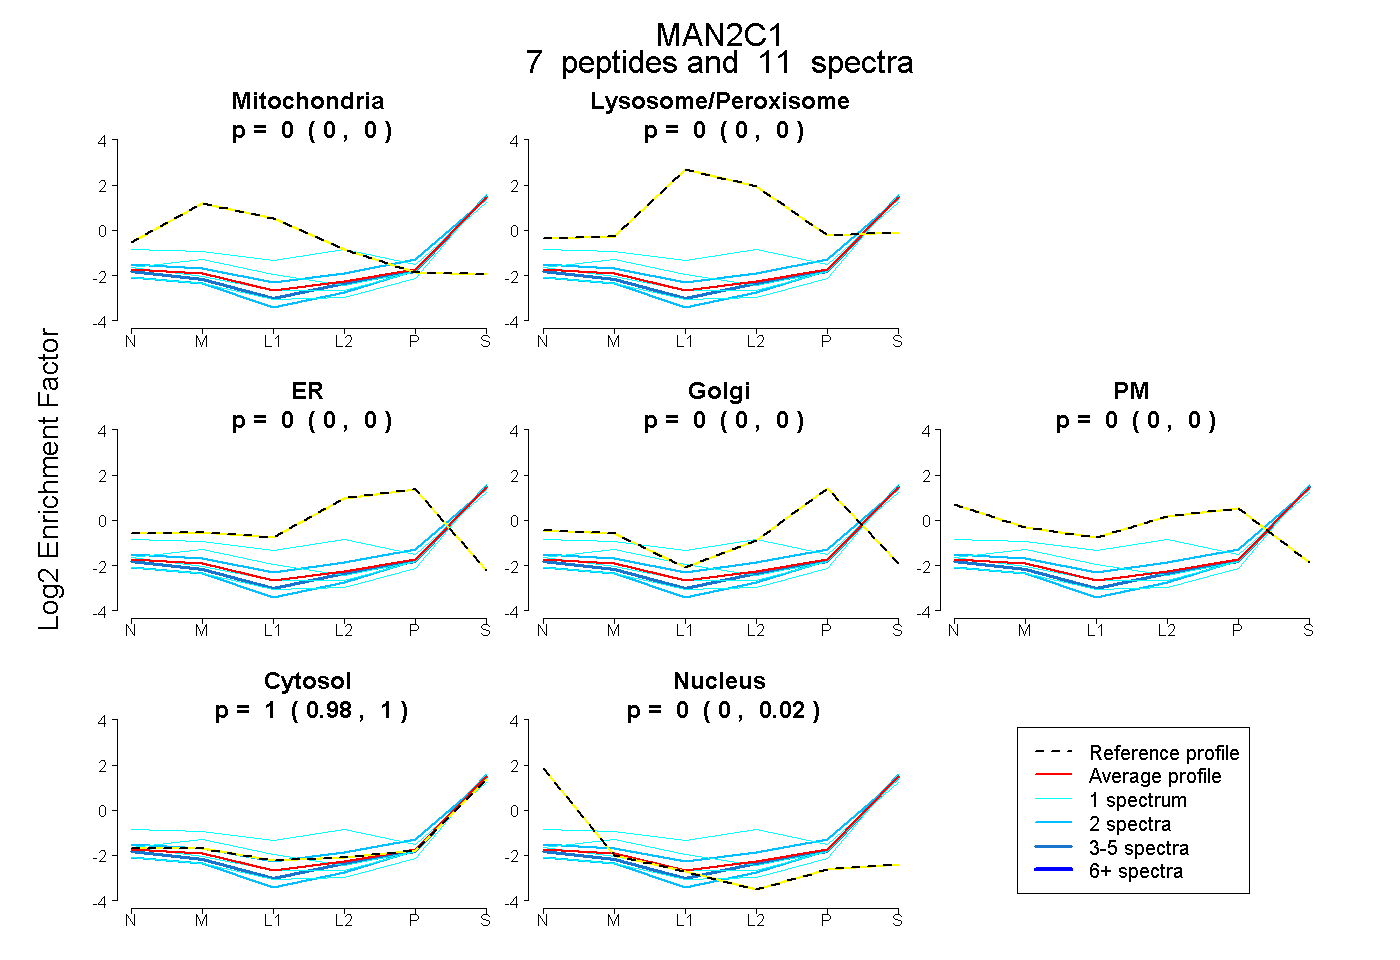 |
0.000 0.000 | 0.000 |
0.000 0.000 | 0.000 |
0.000 0.000 | 0.000 |
0.000 0.000 | 0.000 |
0.000 0.000 | 0.000 |
0.996 0.982 | 1.000 |
0.004 0.000 | 0.016 |
|||
| Plot | Lyso | Other | |||||||||||
| Expt C |
13 peptides |
40 spectra |
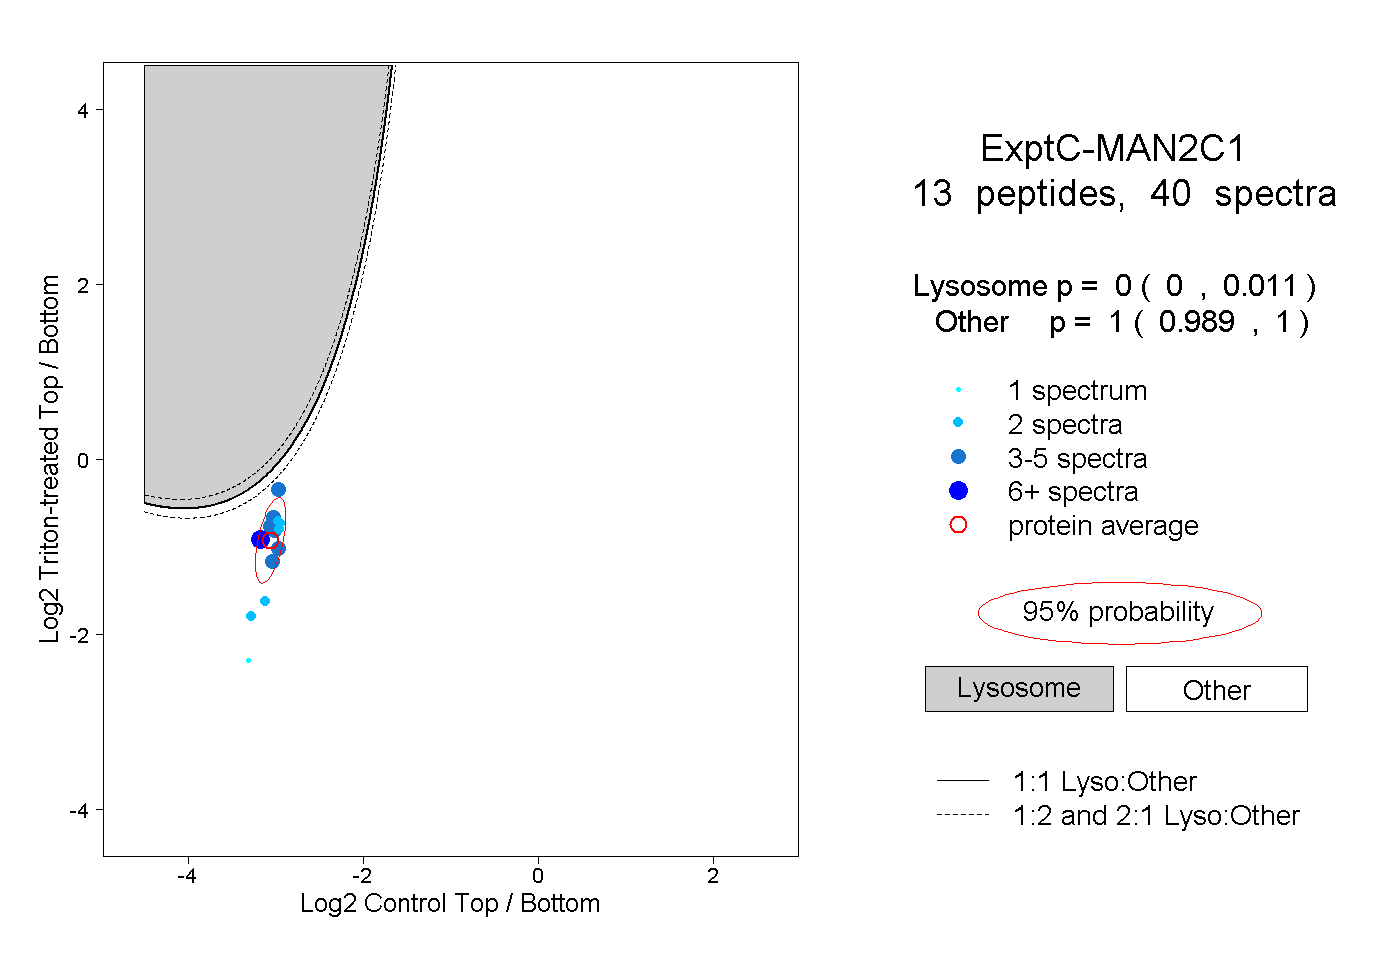 |
0.000 0.000 | 0.011 |
1.000 0.989 | 1.000 |
||||||||
| Plot | Lyso | Other | |||||||||||
| Expt D |
1 peptide |
1 spectrum |
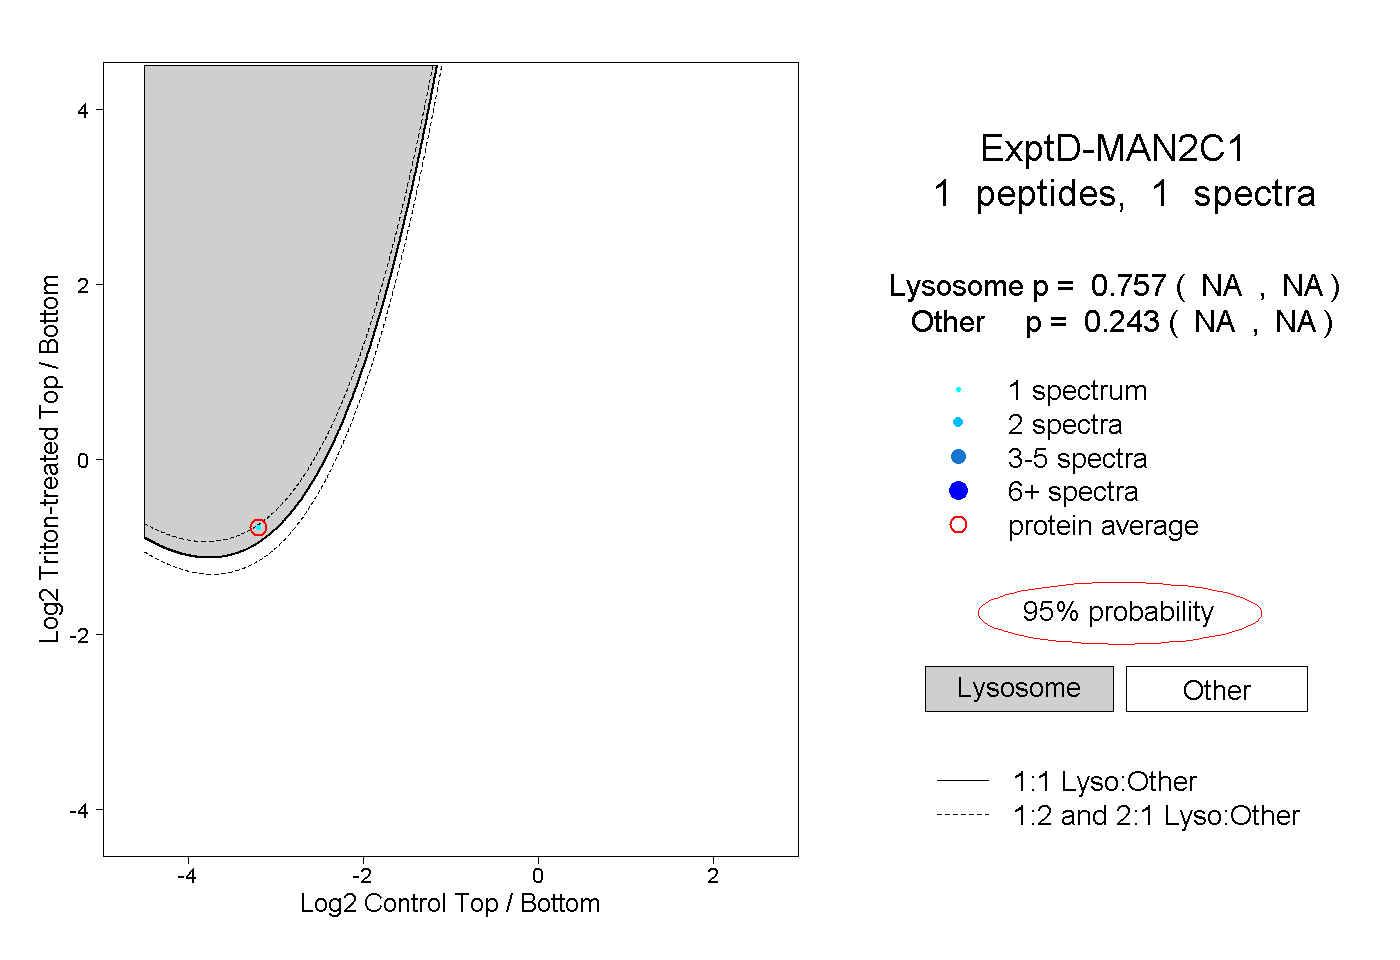 |
0.757 NA | NA |
0.243 NA | NA |