 13
13peptides
spectra
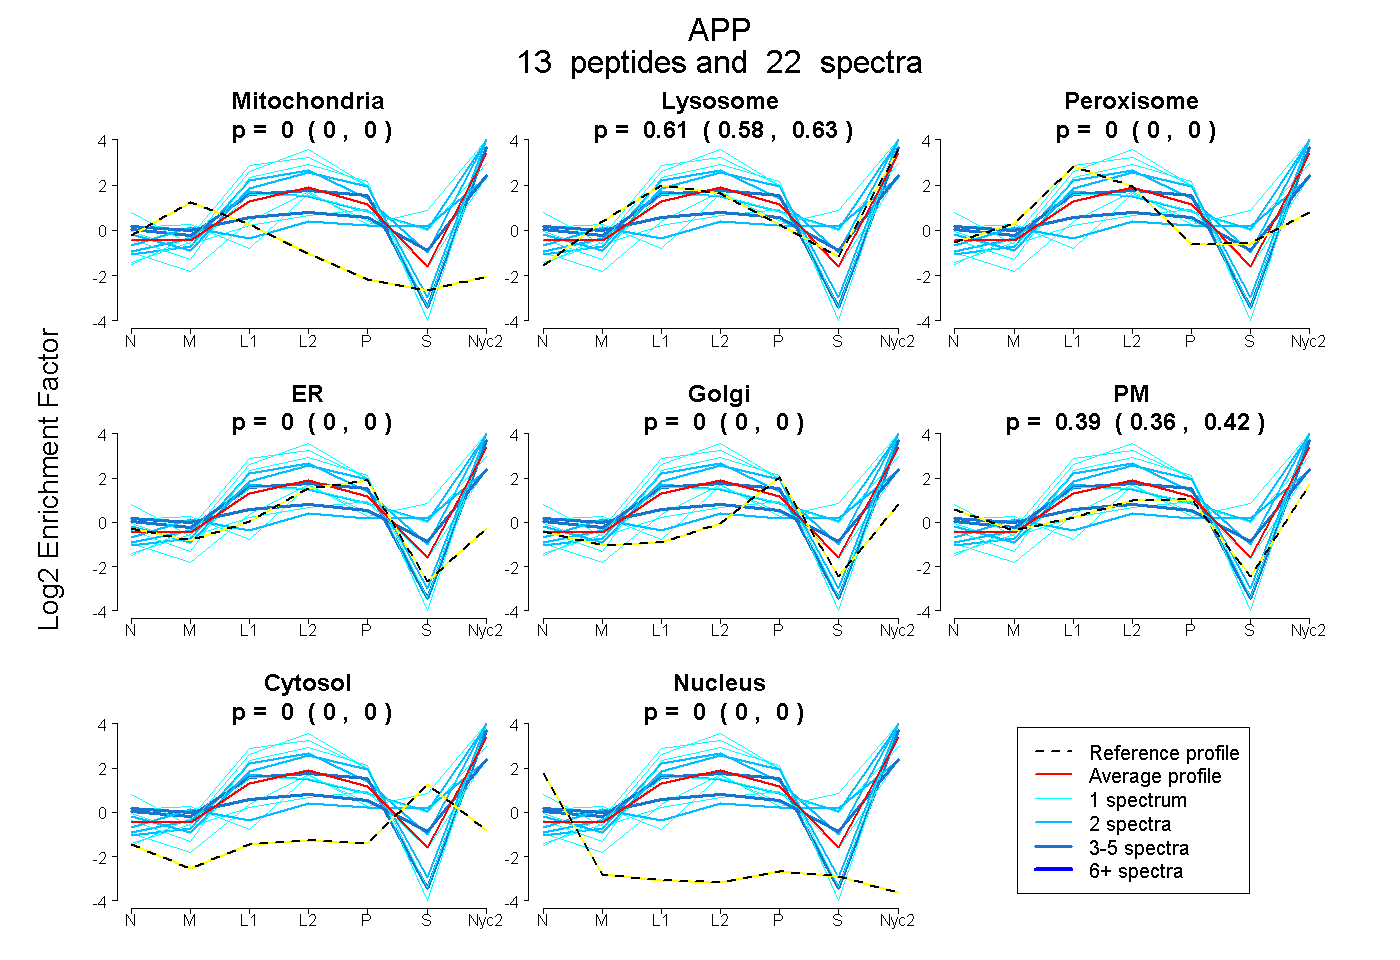
0.000 | 0.000
0.575 | 0.631
0.000 | 0.000
0.000 | 0.000
0.000 | 0.000
0.365 | 0.419
0.000 | 0.000
0.000 | 0.000
1peptide
spectra
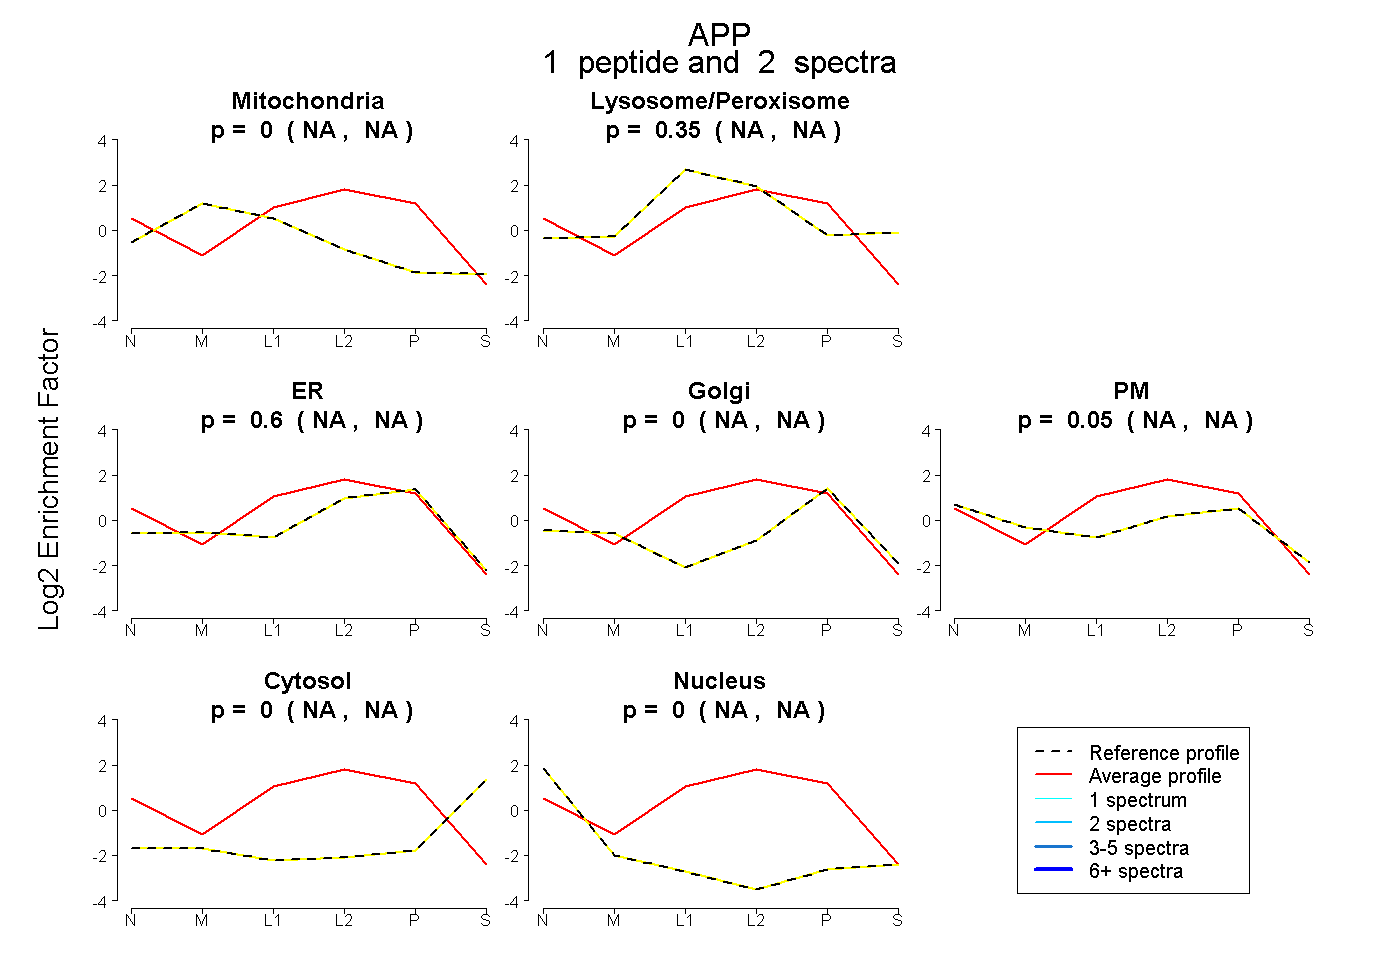
NA | NA
NA | NA
NA | NA
NA | NA
NA | NA
NA | NA
NA | NA
14peptides
spectra
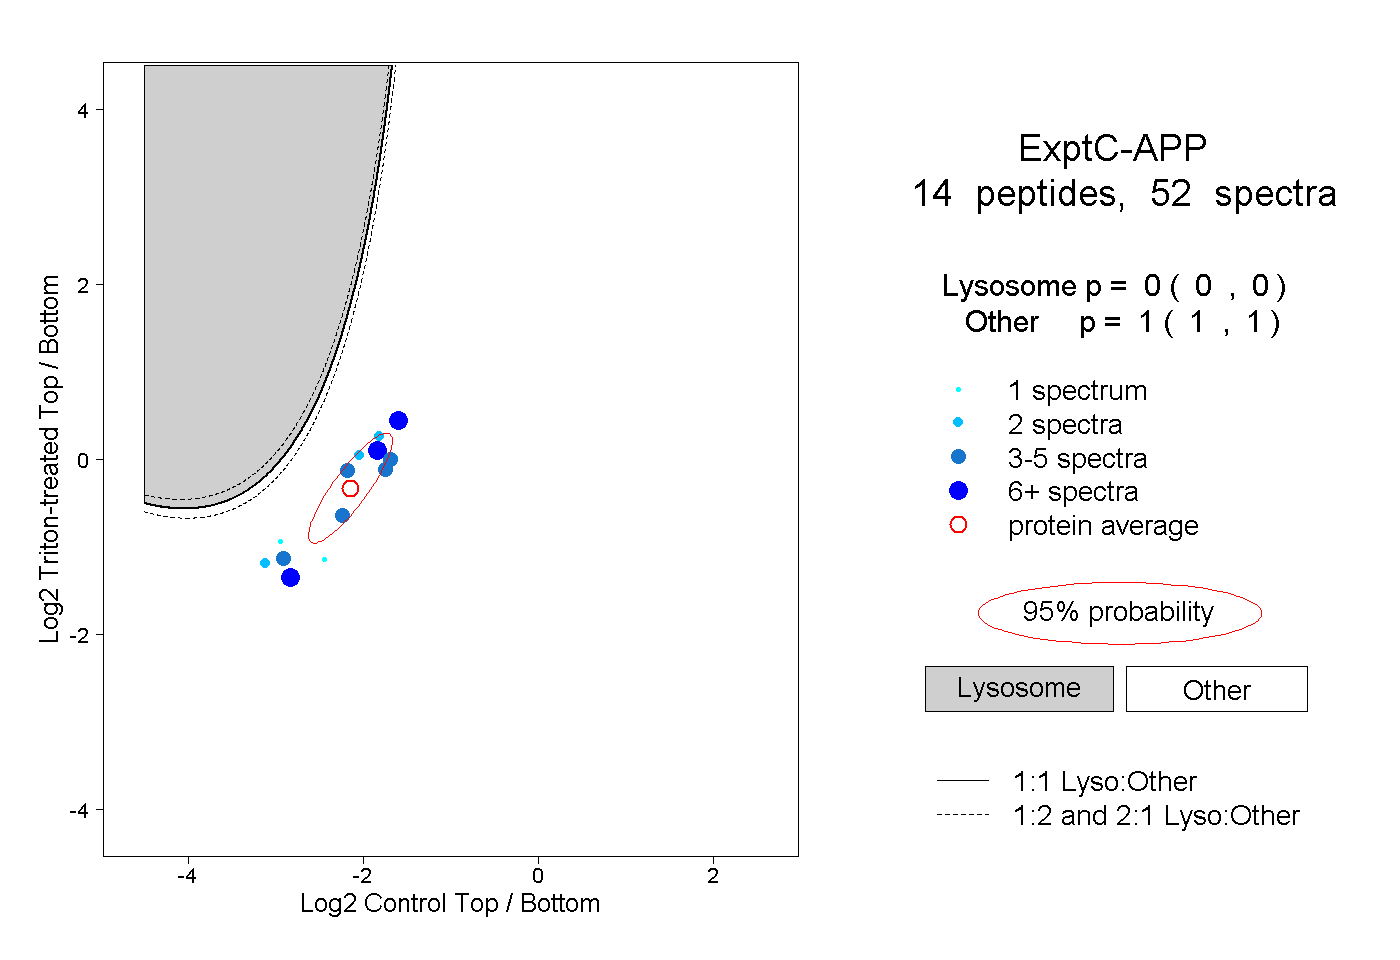
0.000 | 0.000
1.000 | 1.000
4peptides
spectra
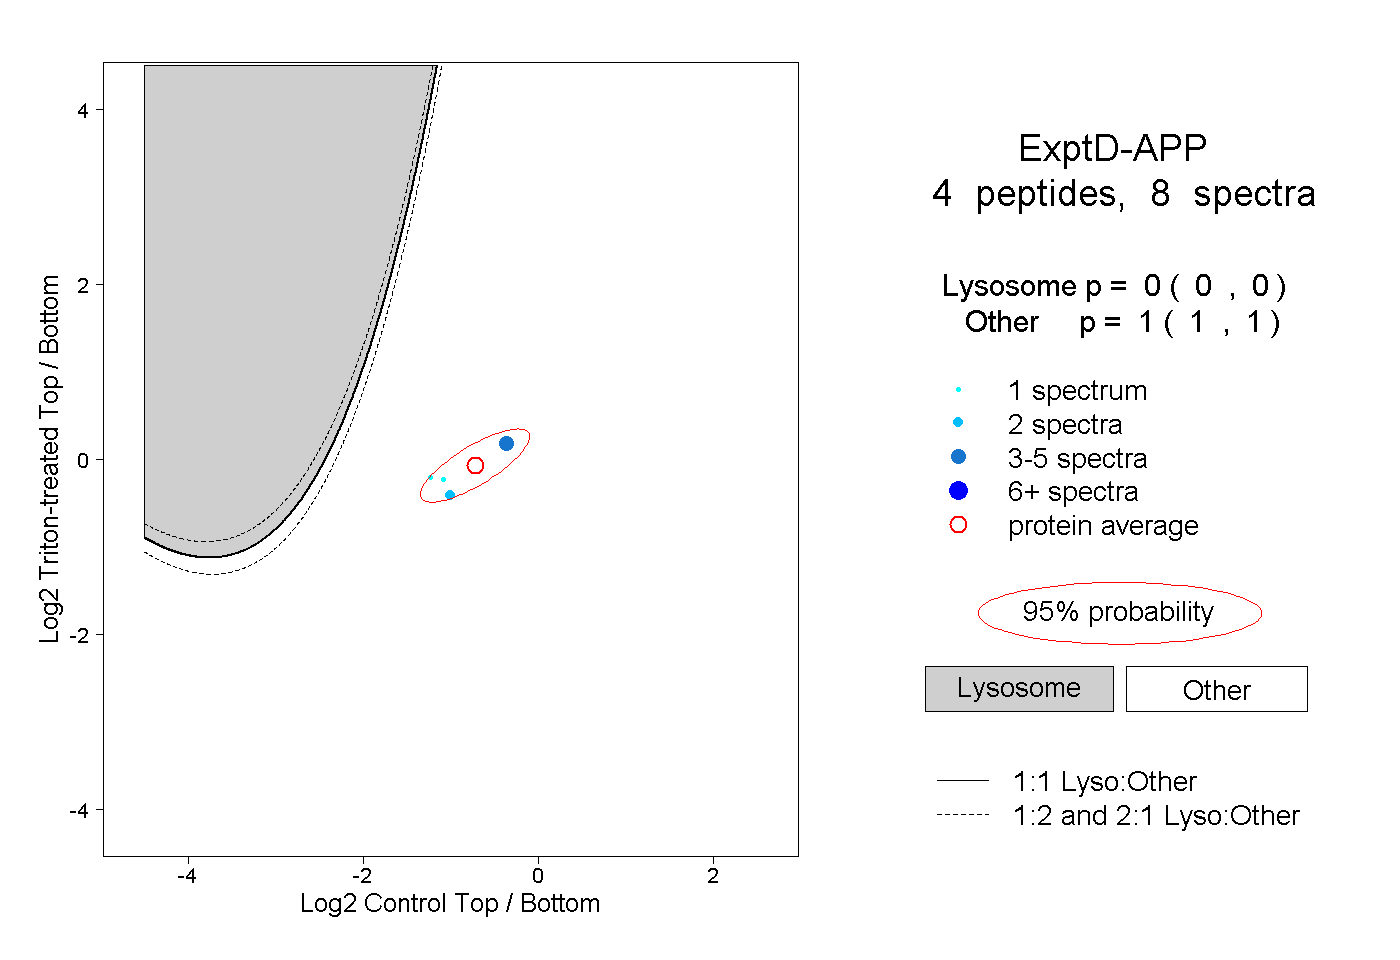
0.000 | 0.000
1.000 | 1.000