 2
2peptides
spectra
0.102 | 0.223
0.016 | 0.141
0.000 | 0.077
0.000 | 0.138
0.000 | 0.000
0.590 | 0.744
0.000 | 0.000
0.000 | 0.000
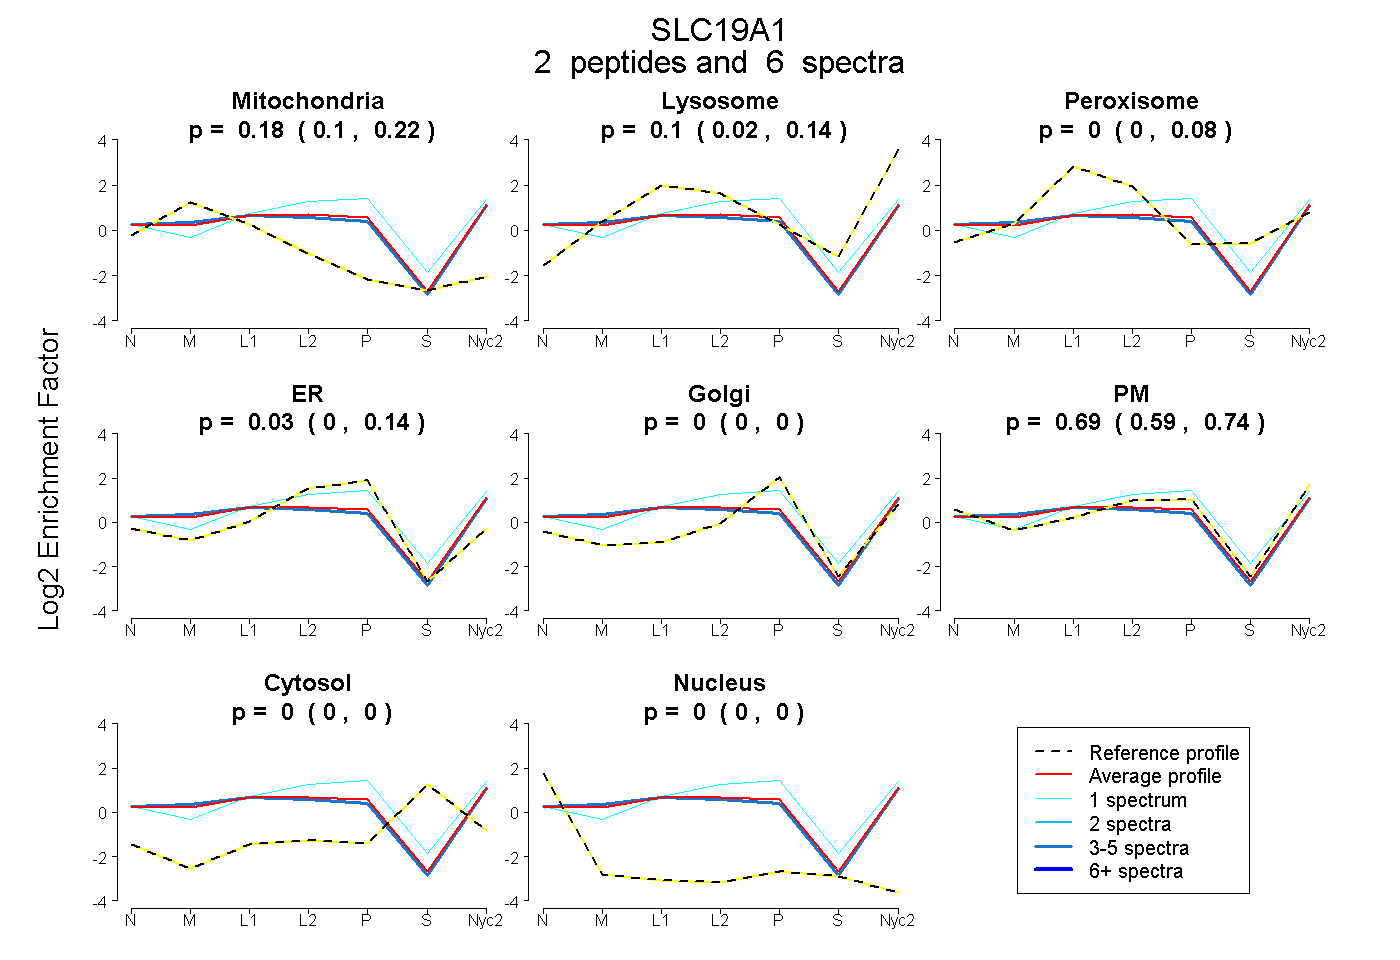
| Plot | Mito | Lyso | Perox | ER | Golgi | PM | Cytosol | Nucleus | |||||
| Expt A |
2 peptides |
6 spectra |
|
0.181 0.102 | 0.223 |
0.096 0.016 | 0.141 |
0.000 0.000 | 0.077 |
0.031 0.000 | 0.138 |
0.000 0.000 | 0.000 |
0.691 0.590 | 0.744 |
0.000 0.000 | 0.000 |
0.000 0.000 | 0.000 |