 10
10peptides
spectra
0.000 | 0.000
0.366 | 0.378
0.000 | 0.000
0.032 | 0.059
0.125 | 0.148
0.000 | 0.000
0.438 | 0.446
0.000 | 0.000
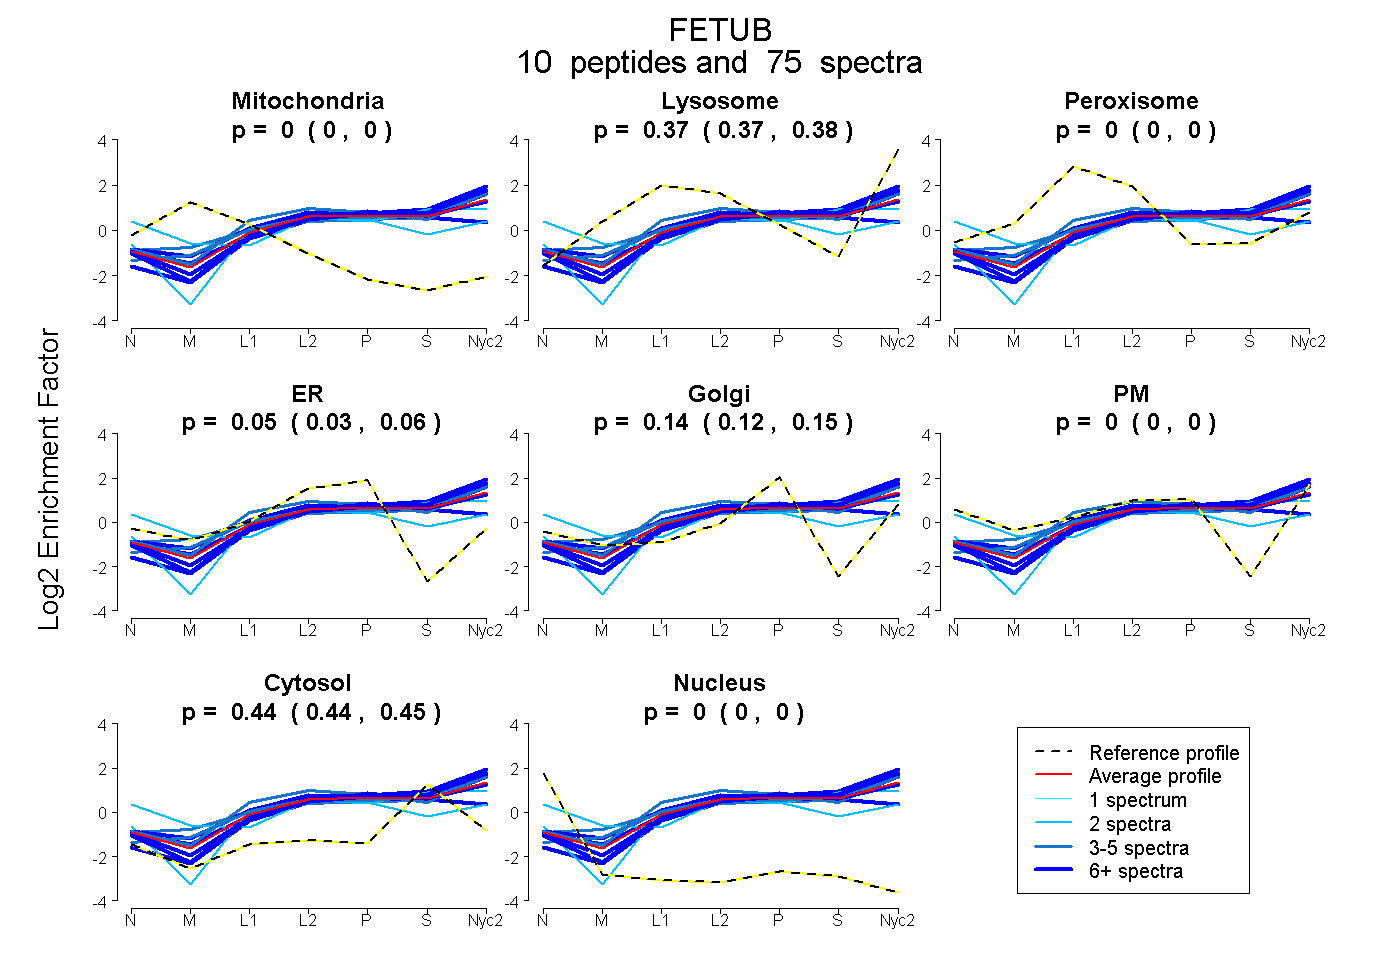
| Plot | Mito | Lyso | Perox | ER | Golgi | PM | Cytosol | Nucleus | |||||
| Expt A |
10 peptides |
75 spectra |
|
0.000 0.000 | 0.000 |
0.373 0.366 | 0.378 |
0.000 0.000 | 0.000 |
0.046 0.032 | 0.059 |
0.138 0.125 | 0.148 |
0.000 0.000 | 0.000 |
0.442 0.438 | 0.446 |
0.000 0.000 | 0.000 |
| 15 spectra, AMFHVNKPR | 0.000 | 0.403 | 0.000 | 0.000 | 0.203 | 0.000 | 0.393 | 0.000 | ||
| 7 spectra, SPECPGPEK | 0.000 | 0.325 | 0.000 | 0.033 | 0.186 | 0.000 | 0.457 | 0.000 | ||
| 23 spectra, SPGVPPQR | 0.000 | 0.371 | 0.000 | 0.000 | 0.156 | 0.000 | 0.473 | 0.000 | ||
| 2 spectra, NTAPTSSPSITAPR | 0.000 | 0.000 | 0.054 | 0.056 | 0.000 | 0.515 | 0.375 | 0.000 | ||
| 2 spectra, GSIQHLPEQEEPEDSK | 0.000 | 0.250 | 0.000 | 0.131 | 0.000 | 0.029 | 0.590 | 0.000 | ||
| 4 spectra, LVVLPFPGK | 0.000 | 0.482 | 0.000 | 0.124 | 0.032 | 0.000 | 0.362 | 0.000 | ||
| 6 spectra, DGYMLTLNR | 0.000 | 0.402 | 0.000 | 0.000 | 0.101 | 0.000 | 0.497 | 0.000 | ||
| 4 spectra, FNSENPSK | 0.000 | 0.464 | 0.000 | 0.000 | 0.135 | 0.003 | 0.398 | 0.000 | ||
| 7 spectra, IFYETVHGQCK | 0.000 | 0.176 | 0.143 | 0.251 | 0.000 | 0.000 | 0.430 | 0.000 | ||
| 5 spectra, QYALVK | 0.000 | 0.487 | 0.000 | 0.000 | 0.081 | 0.000 | 0.432 | 0.000 |
| Plot | Mito | Lyso or Perox | ER | Golgi | PM | Cytosol | Nucleus | ||||||
| Expt B |
7 peptides |
23 spectra |
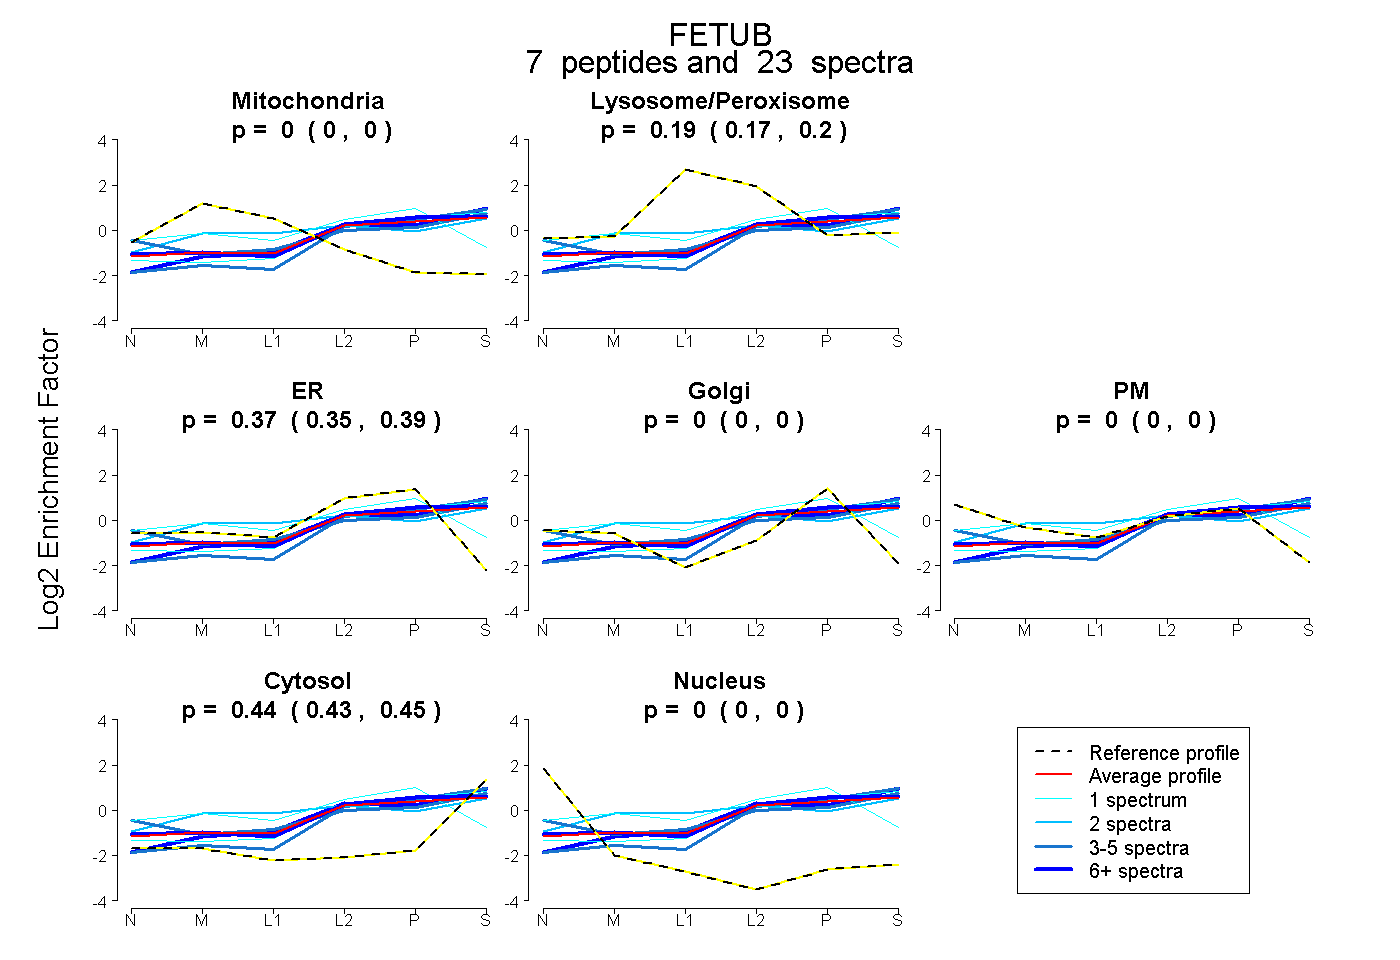 |
0.000 0.000 | 0.000 |
0.190 0.173 | 0.203 |
0.371 0.353 | 0.389 |
0.000 0.000 | 0.000 |
0.000 0.000 | 0.000 |
0.439 0.427 | 0.448 |
0.000 0.000 | 0.000 |
|||
| Plot | Lyso | Other | |||||||||||
| Expt C |
10 peptides |
175 spectra |
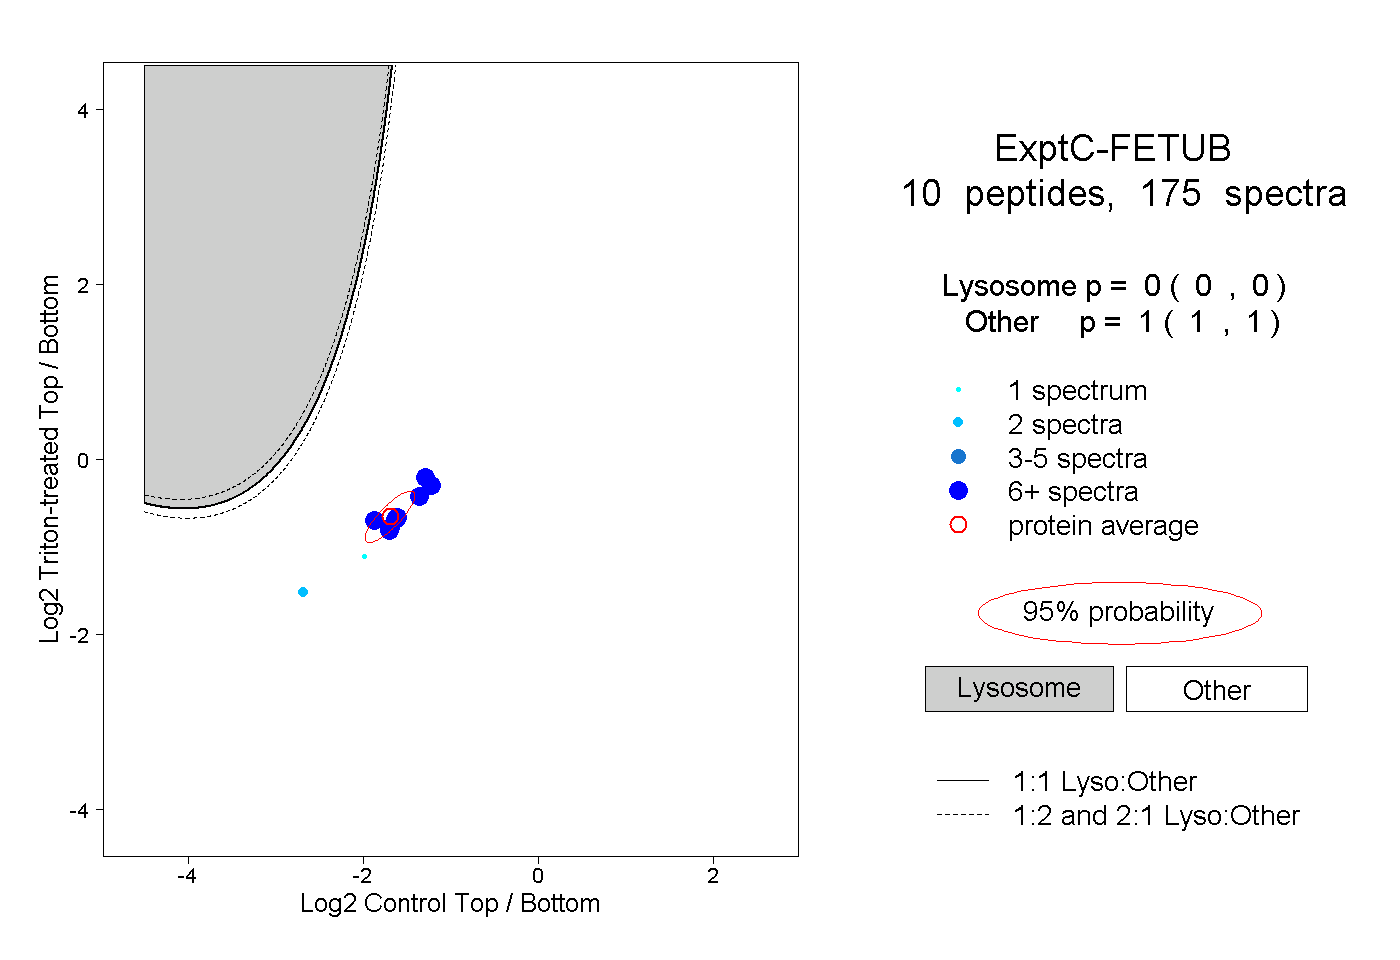 |
0.000 0.000 | 0.000 |
1.000 1.000 | 1.000 |
||||||||
| Plot | Lyso | Other | |||||||||||
| Expt D |
7 peptides |
22 spectra |
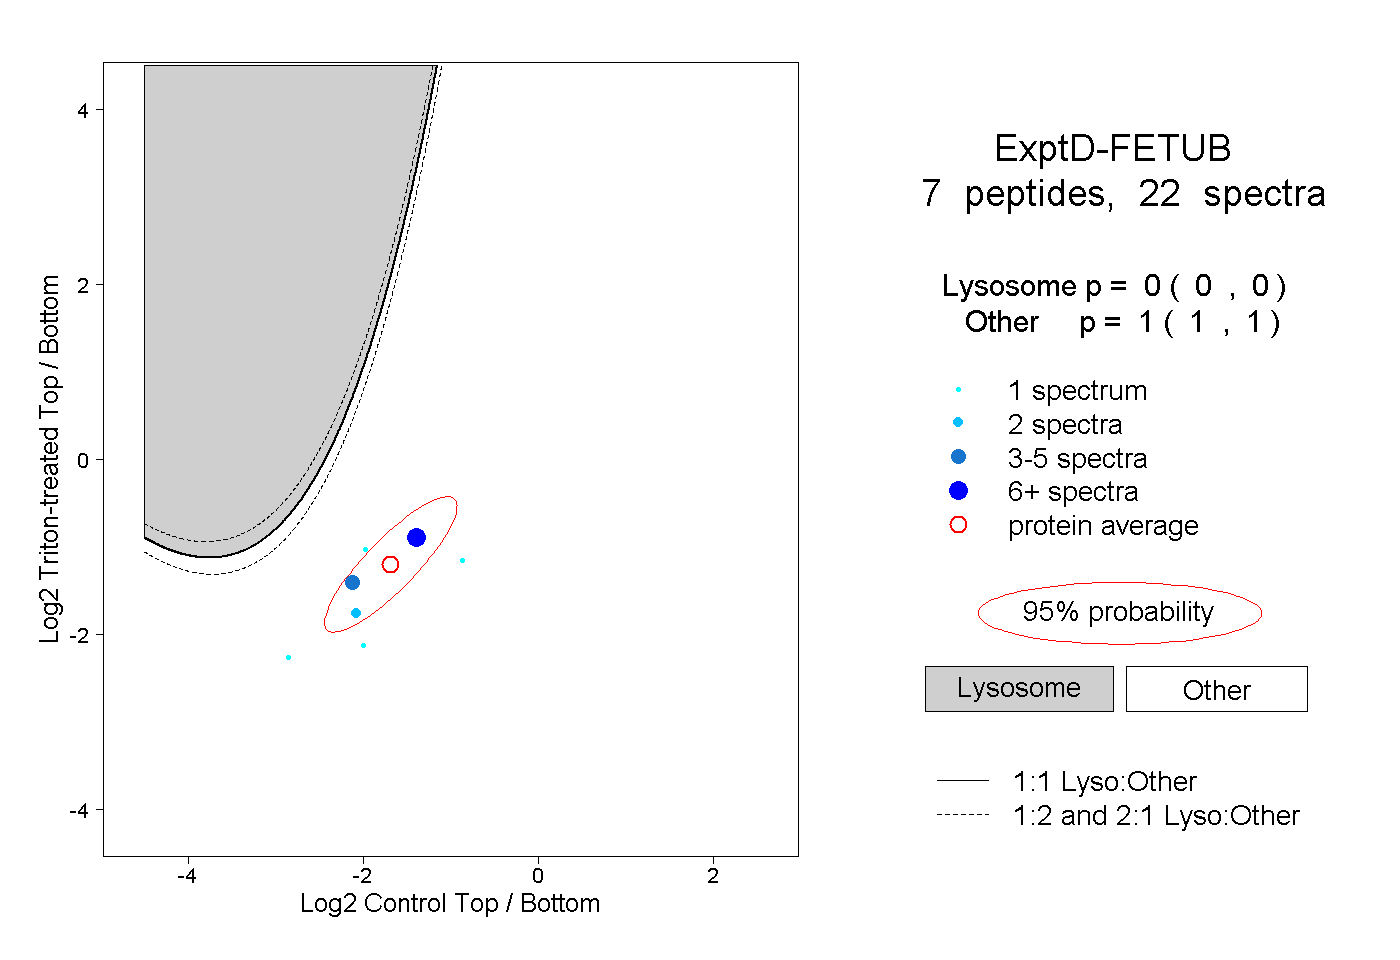 |
0.000 0.000 | 0.000 |
1.000 1.000 | 1.000 |