 3
3peptides
spectra
0.000 | 0.000
0.000 | 0.000
0.000 | 0.015
0.018 | 0.165
0.000 | 0.000
0.000 | 0.015
0.387 | 0.476
0.390 | 0.508
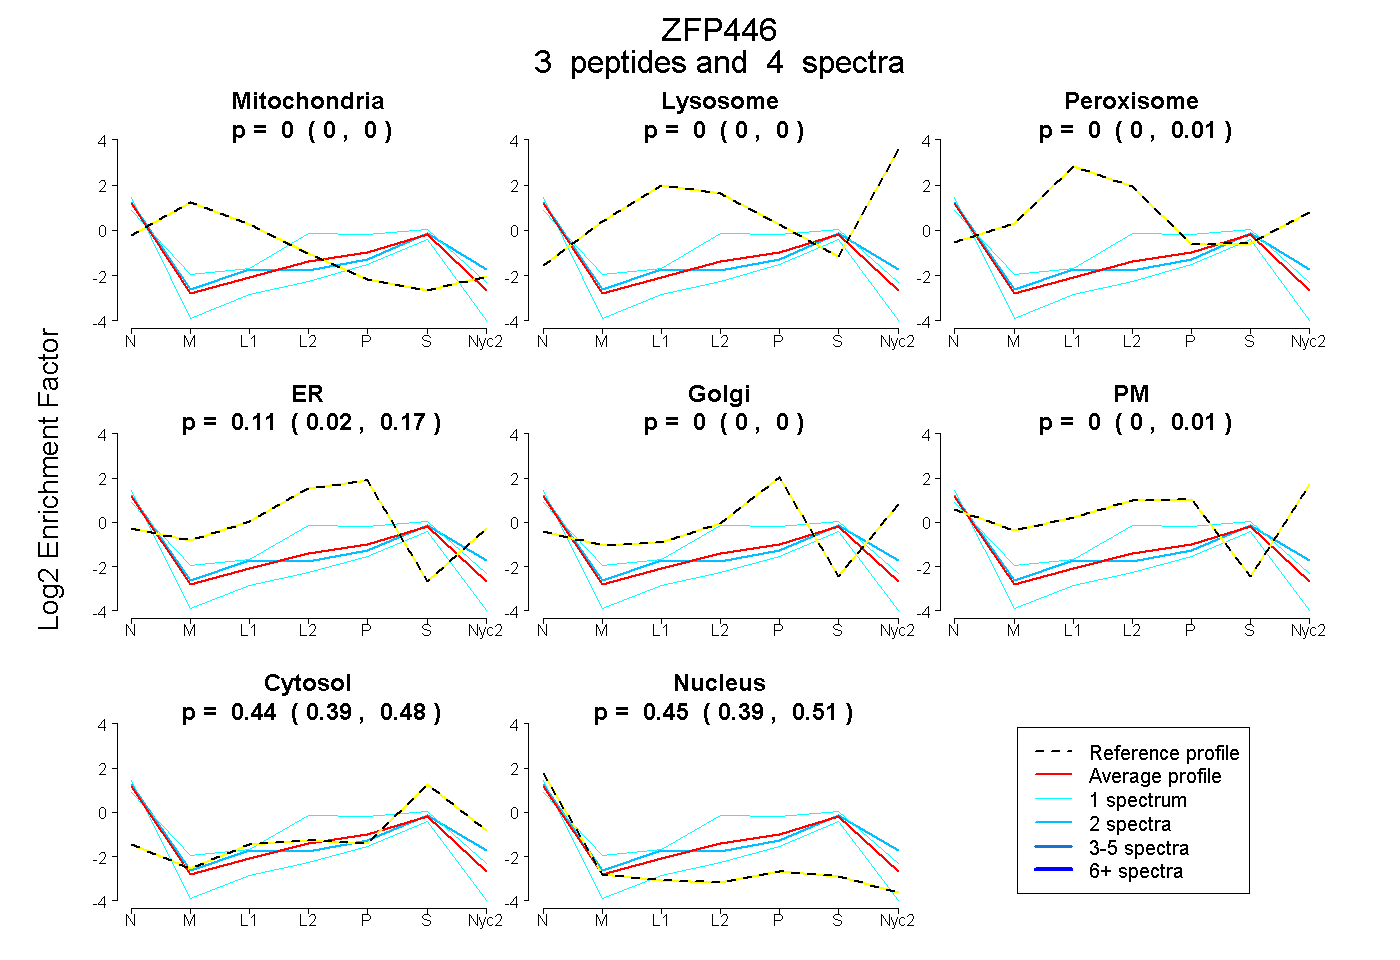
| Plot | Mito | Lyso | Perox | ER | Golgi | PM | Cytosol | Nucleus | |||||
| Expt A |
3 peptides |
4 spectra |
|
0.000 0.000 | 0.000 |
0.000 0.000 | 0.000 |
0.000 0.000 | 0.015 |
0.108 0.018 | 0.165 |
0.000 0.000 | 0.000 |
0.000 0.000 | 0.015 |
0.437 0.387 | 0.476 |
0.455 0.390 | 0.508 |
| 1 spectrum, AGPAEAPQDAGIDR | 0.000 | 0.000 | 0.000 | 0.000 | 0.000 | 0.000 | 0.313 | 0.687 | ||
| 2 spectra, FQLVIHR | 0.000 | 0.000 | 0.000 | 0.000 | 0.000 | 0.120 | 0.471 | 0.408 | ||
| 1 spectrum, SVFIIHLR | 0.000 | 0.000 | 0.000 | 0.314 | 0.000 | 0.000 | 0.424 | 0.262 |