 6
6peptides
spectra
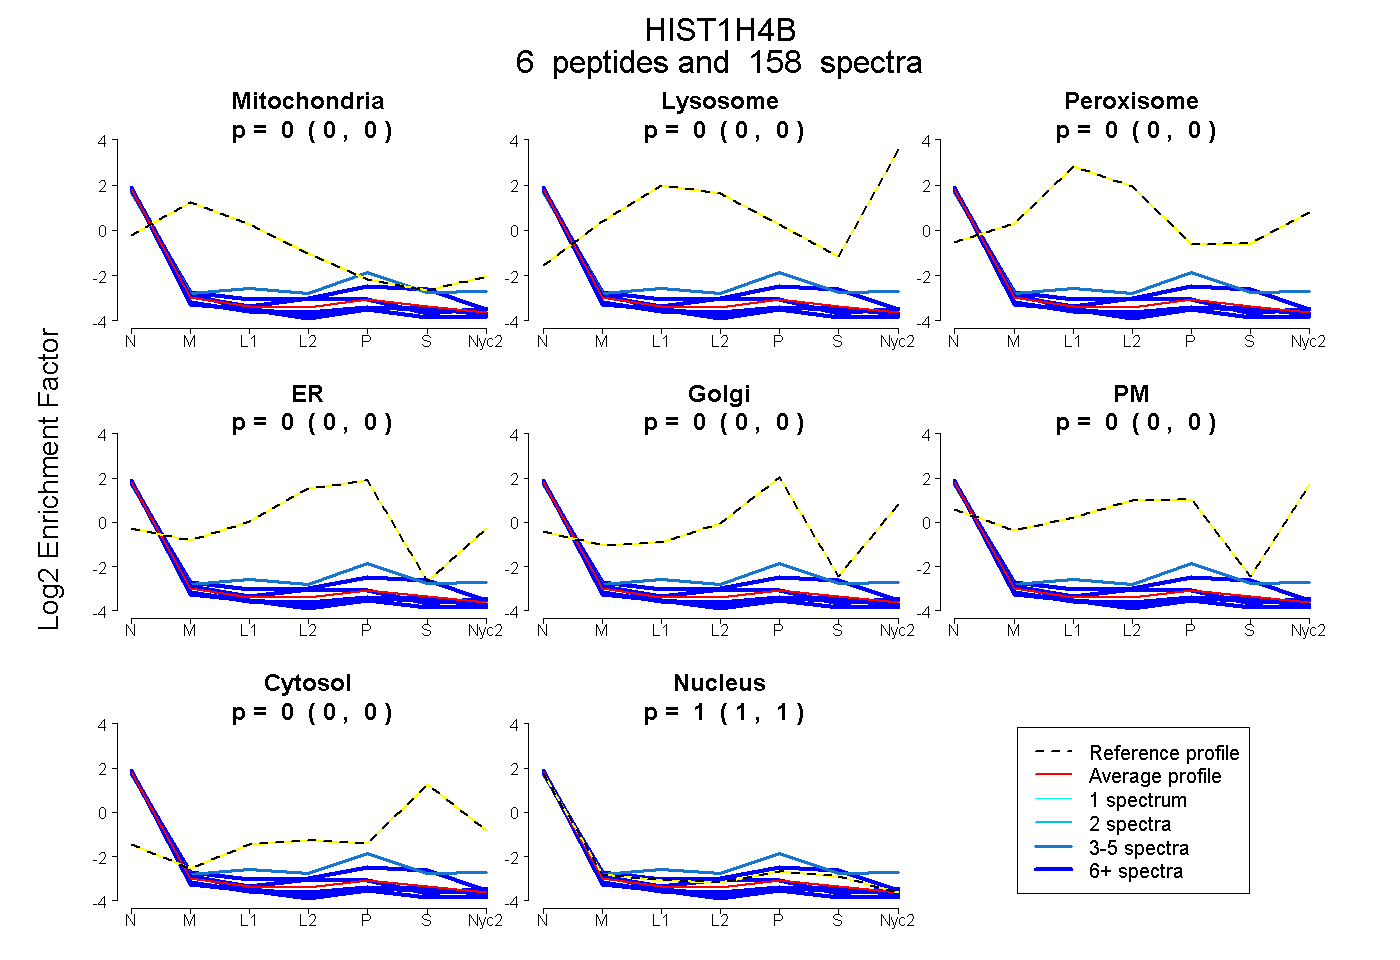
0.000 | 0.000
0.000 | 0.000
0.000 | 0.000
0.000 | 0.000
0.000 | 0.000
0.000 | 0.000
0.000 | 0.000
1.000 | 1.000
5peptides
spectra
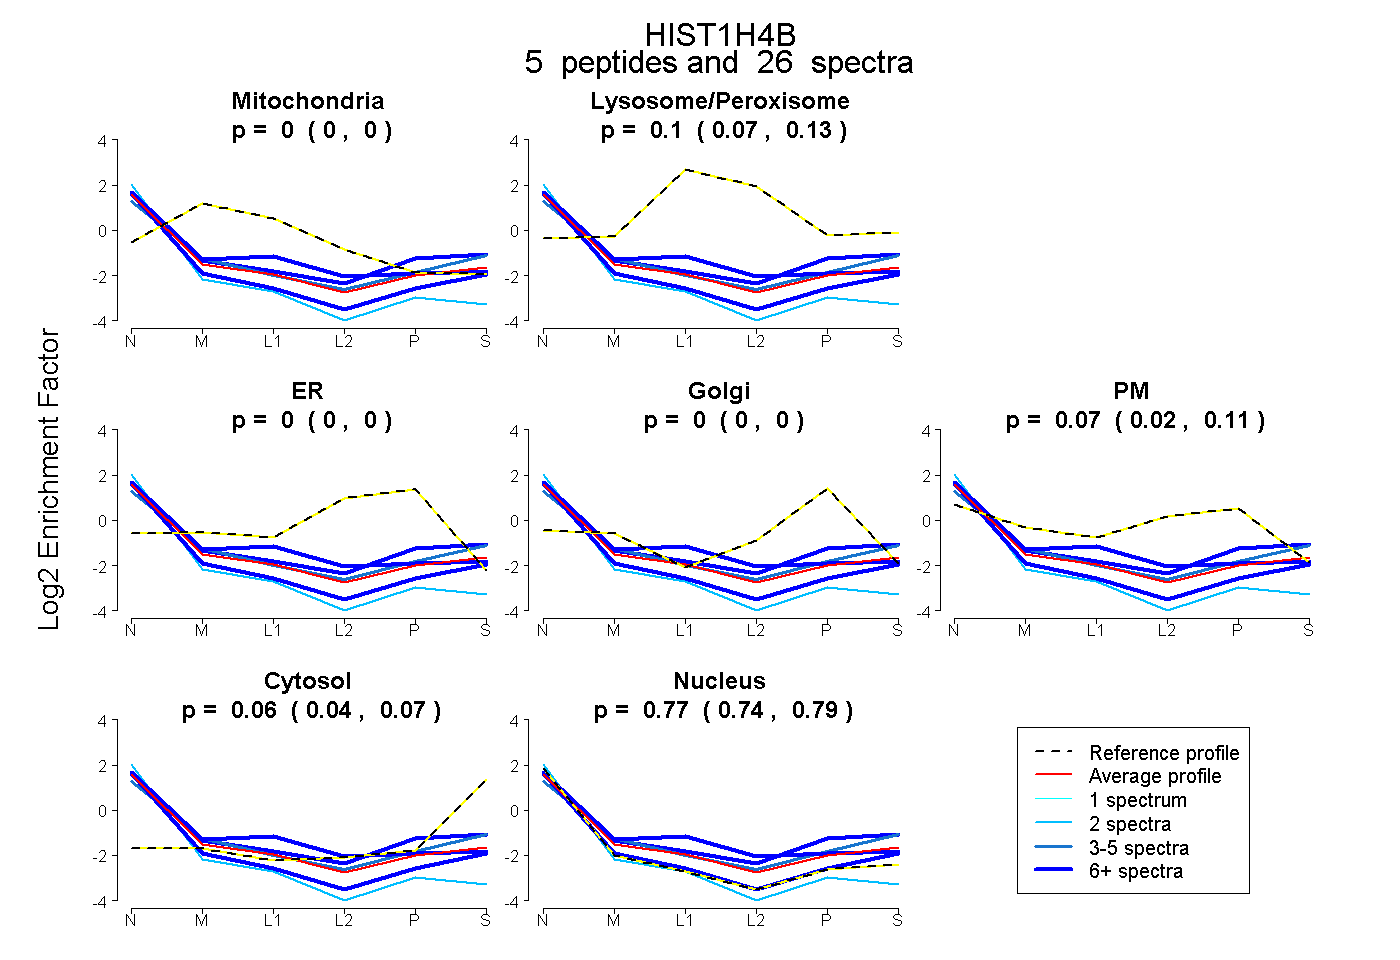
0.000 | 0.001
0.071 | 0.128
0.000 | 0.000
0.000 | 0.000
0.022 | 0.107
0.037 | 0.074
0.744 | 0.793
5peptides
spectra
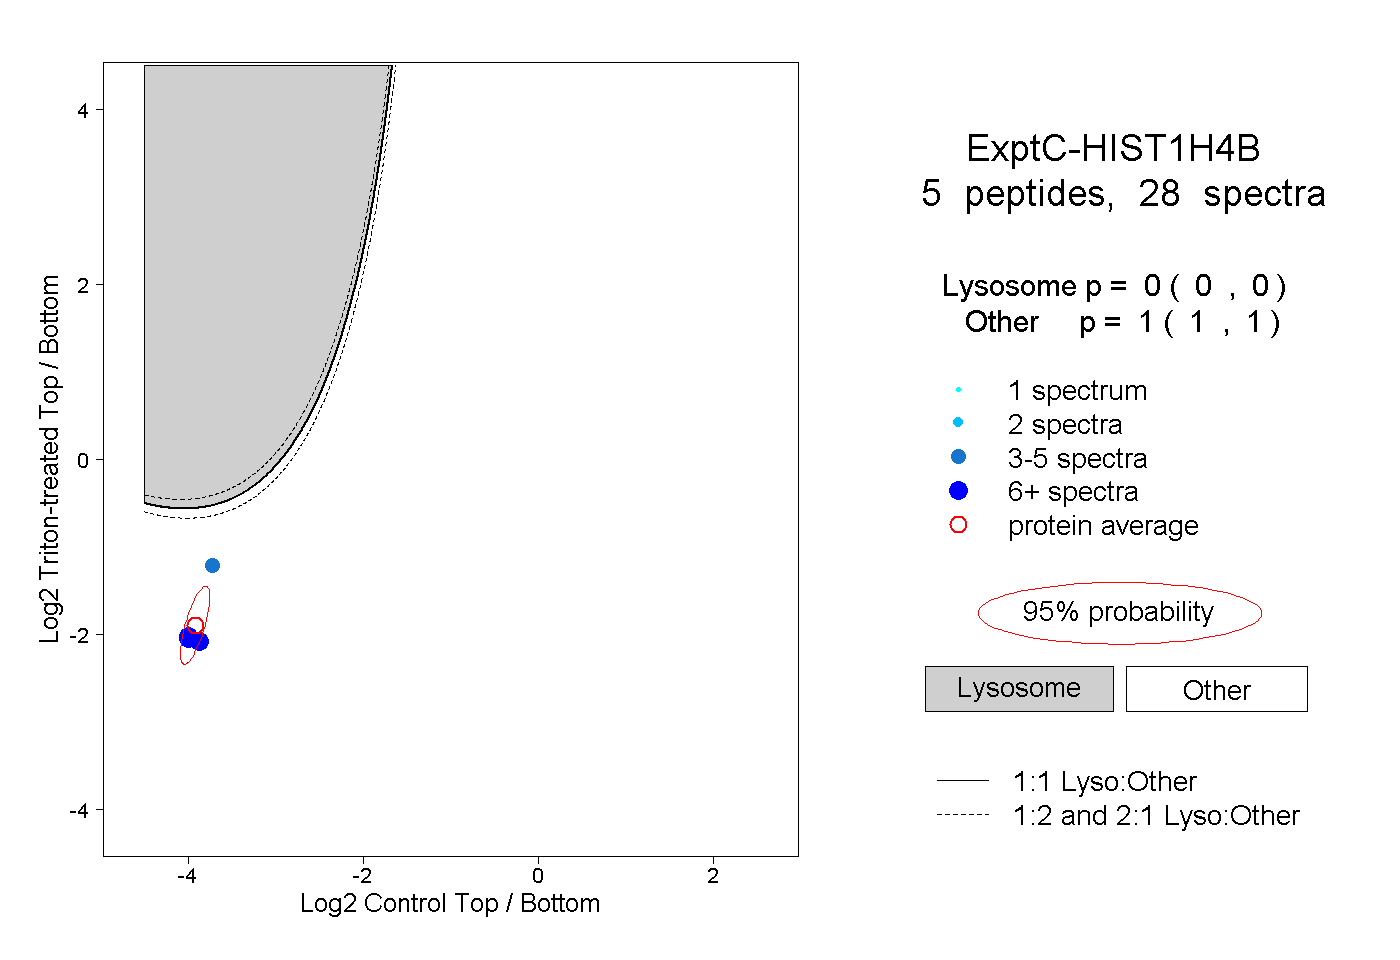
0.000 | 0.000
1.000 | 1.000