5
5peptides
spectra
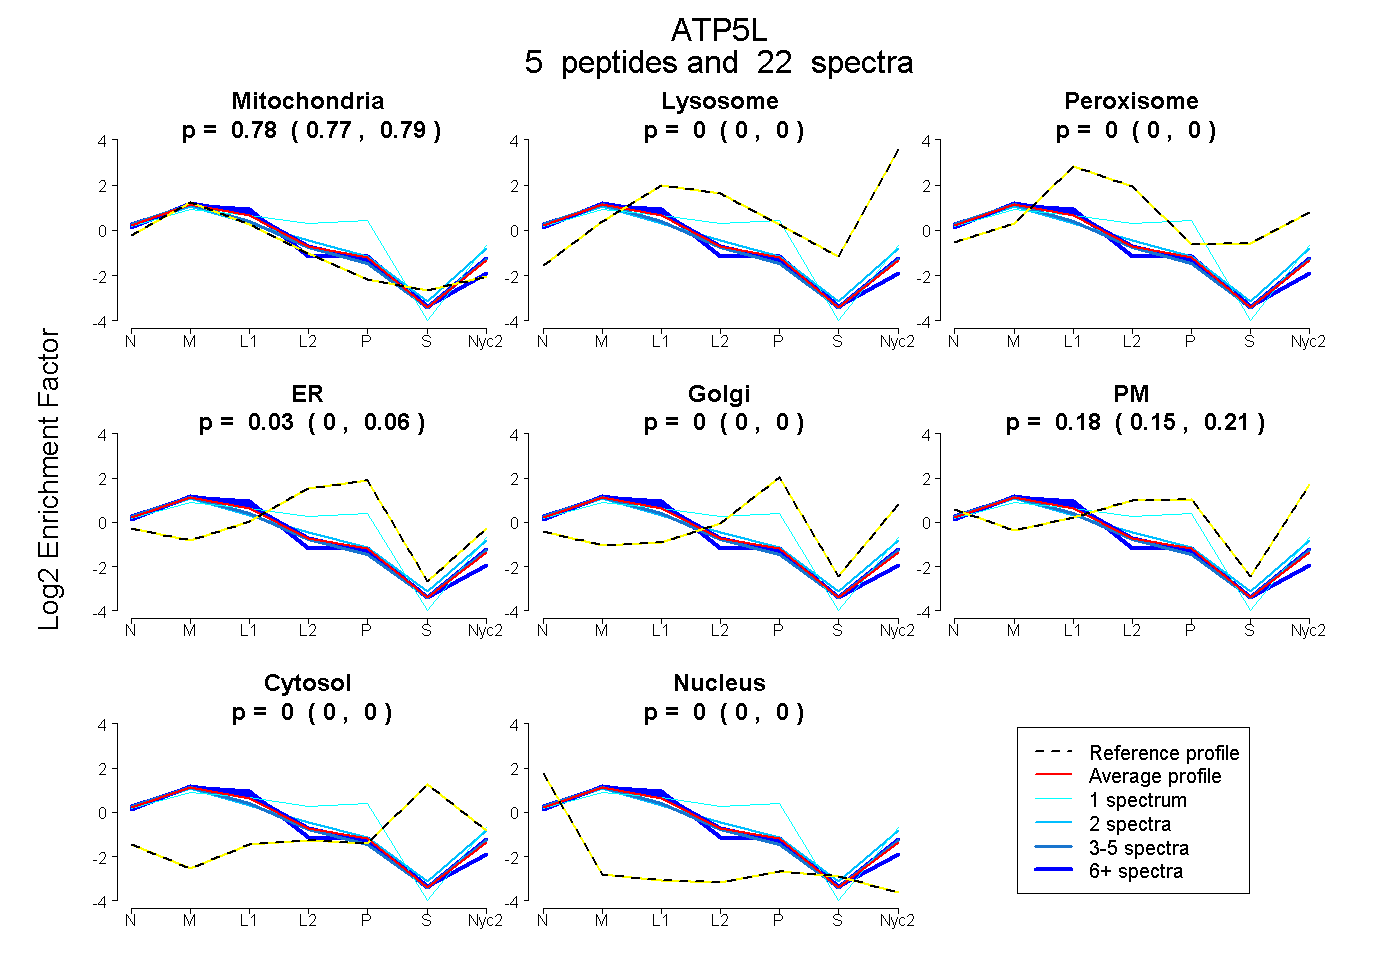
0.770 | 0.791
0.000 | 0.000
0.000 | 0.000
0.002 | 0.060
0.000 | 0.000
0.147 | 0.213
0.000 | 0.000
0.000 | 0.000
3peptides
spectra
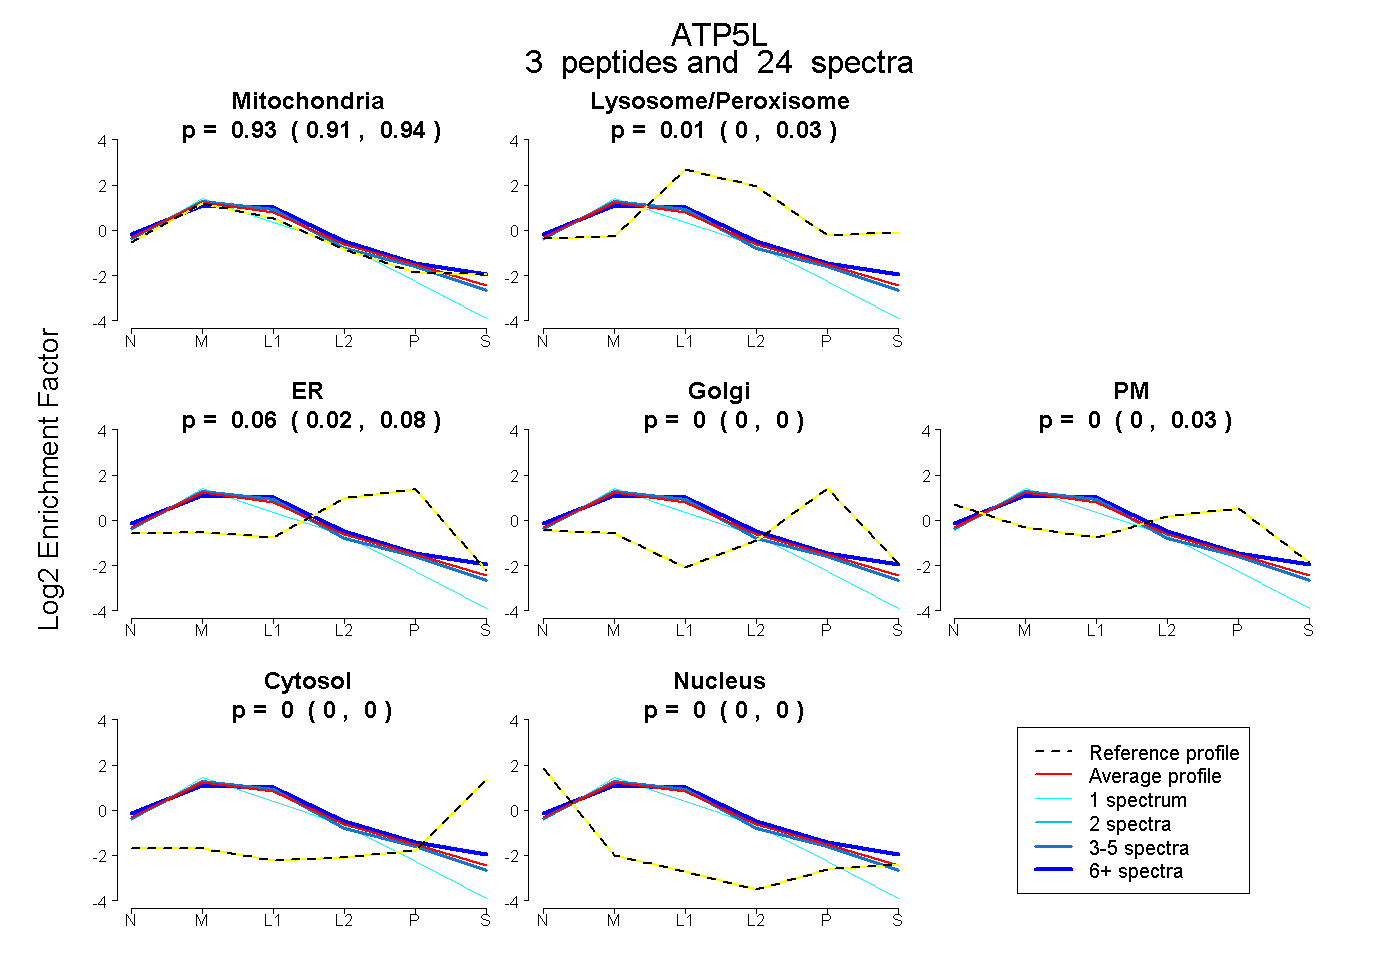
0.909 | 0.937
0.000 | 0.030
0.024 | 0.076
0.000 | 0.000
0.000 | 0.028
0.000 | 0.000
0.000 | 0.000