 1
1peptide
spectra
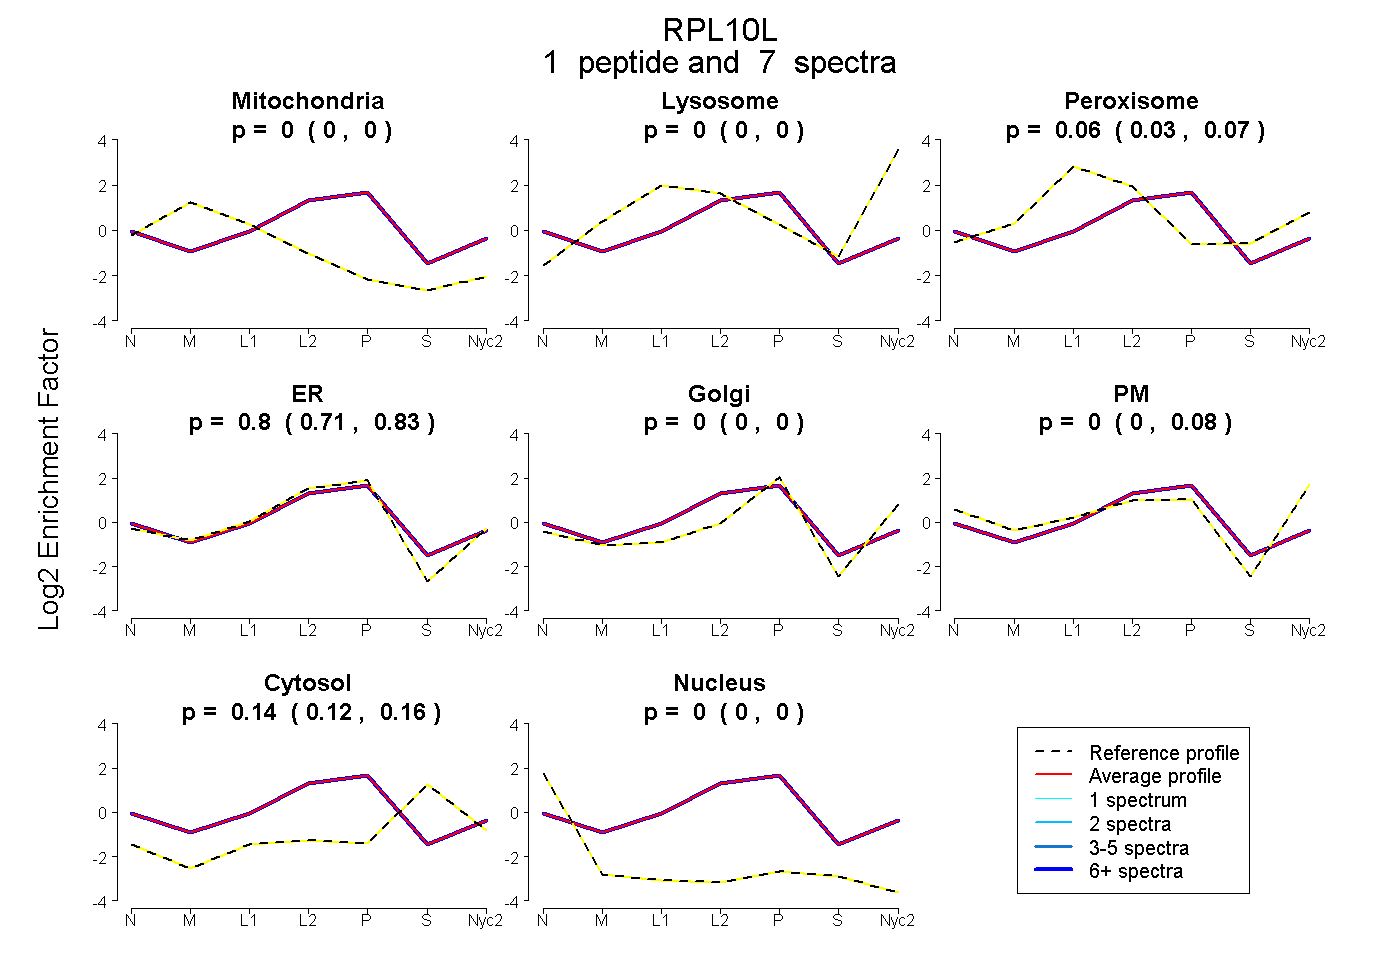
0.000 | 0.000
0.000 | 0.000
0.026 | 0.074
0.713 | 0.834
0.000 | 0.000
0.000 | 0.082
0.116 | 0.161
0.000 | 0.000
1peptide
spectrum
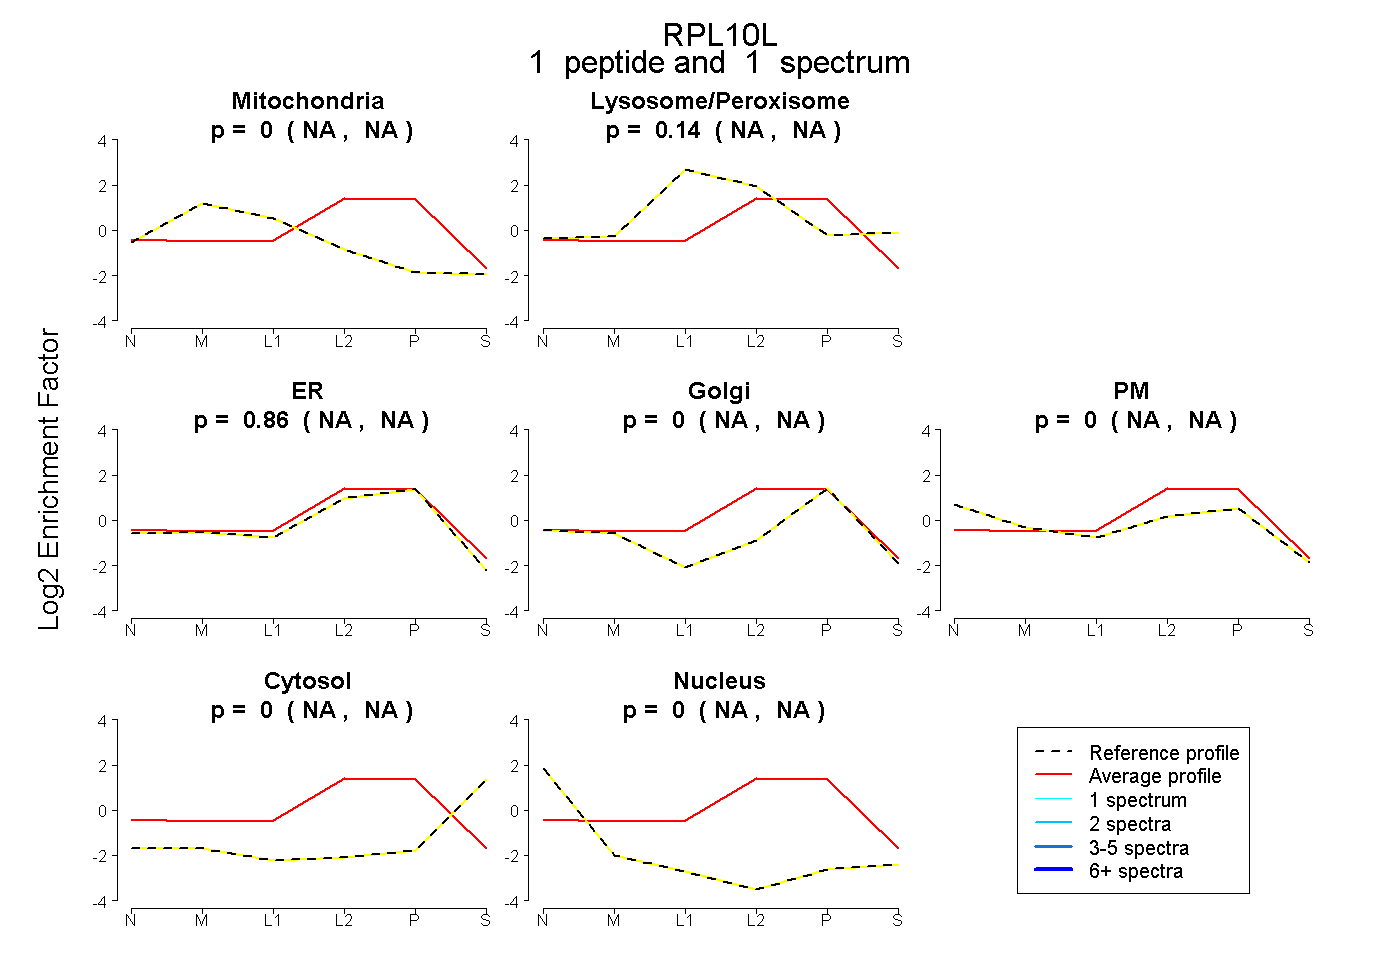
NA | NA
NA | NA
NA | NA
NA | NA
NA | NA
NA | NA
NA | NA
1peptide
spectra
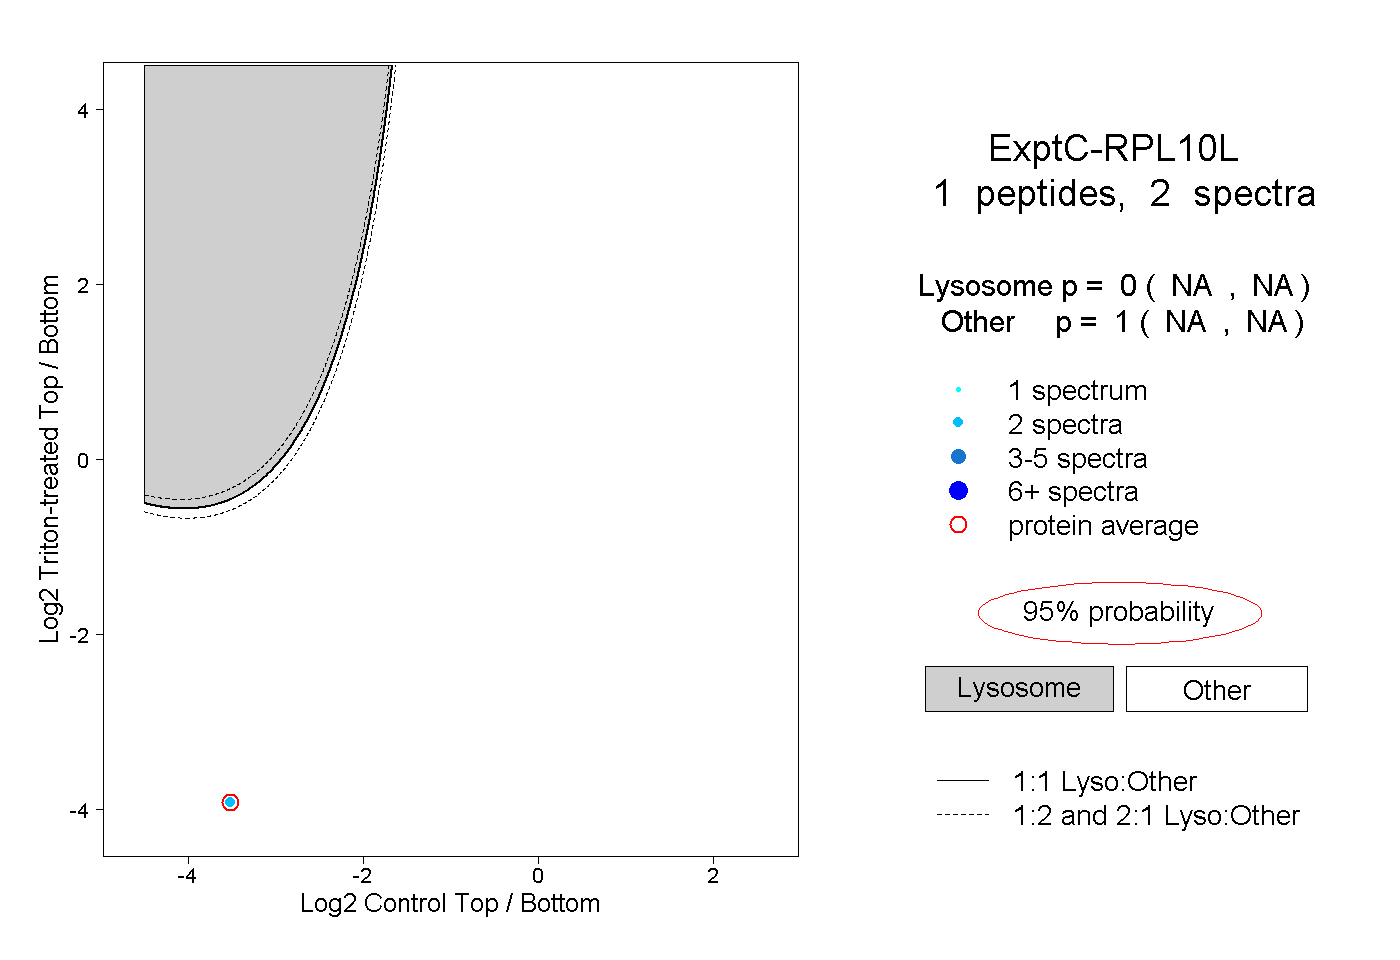
NA | NA
NA | NA