 1
1peptide
spectra
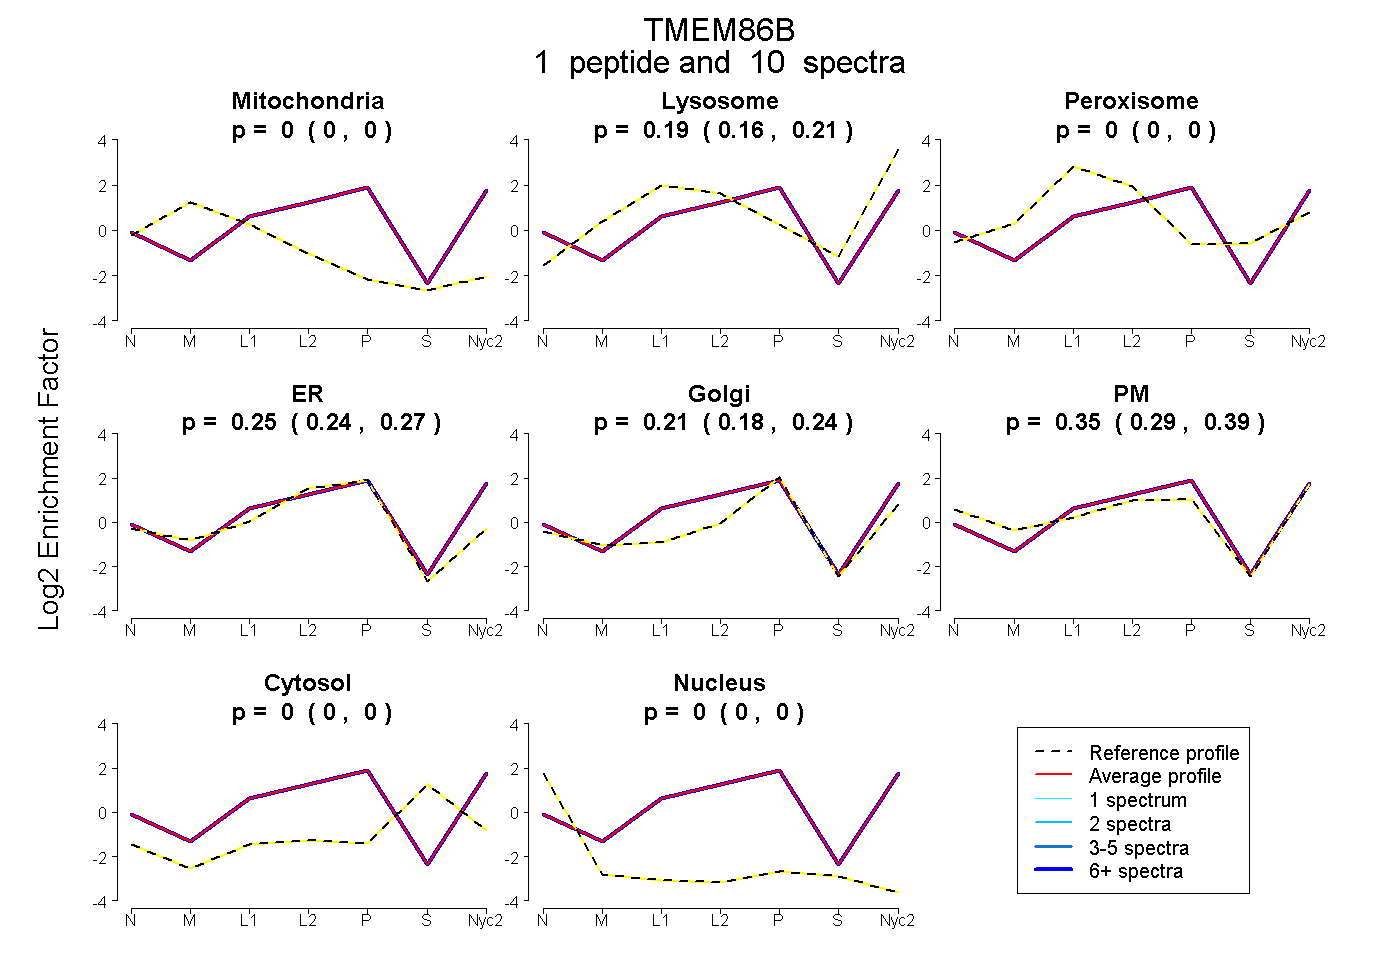
0.000 | 0.000
0.156 | 0.215
0.000 | 0.000
0.237 | 0.266
0.182 | 0.239
0.293 | 0.391
0.000 | 0.000
0.000 | 0.000
1peptide
spectra
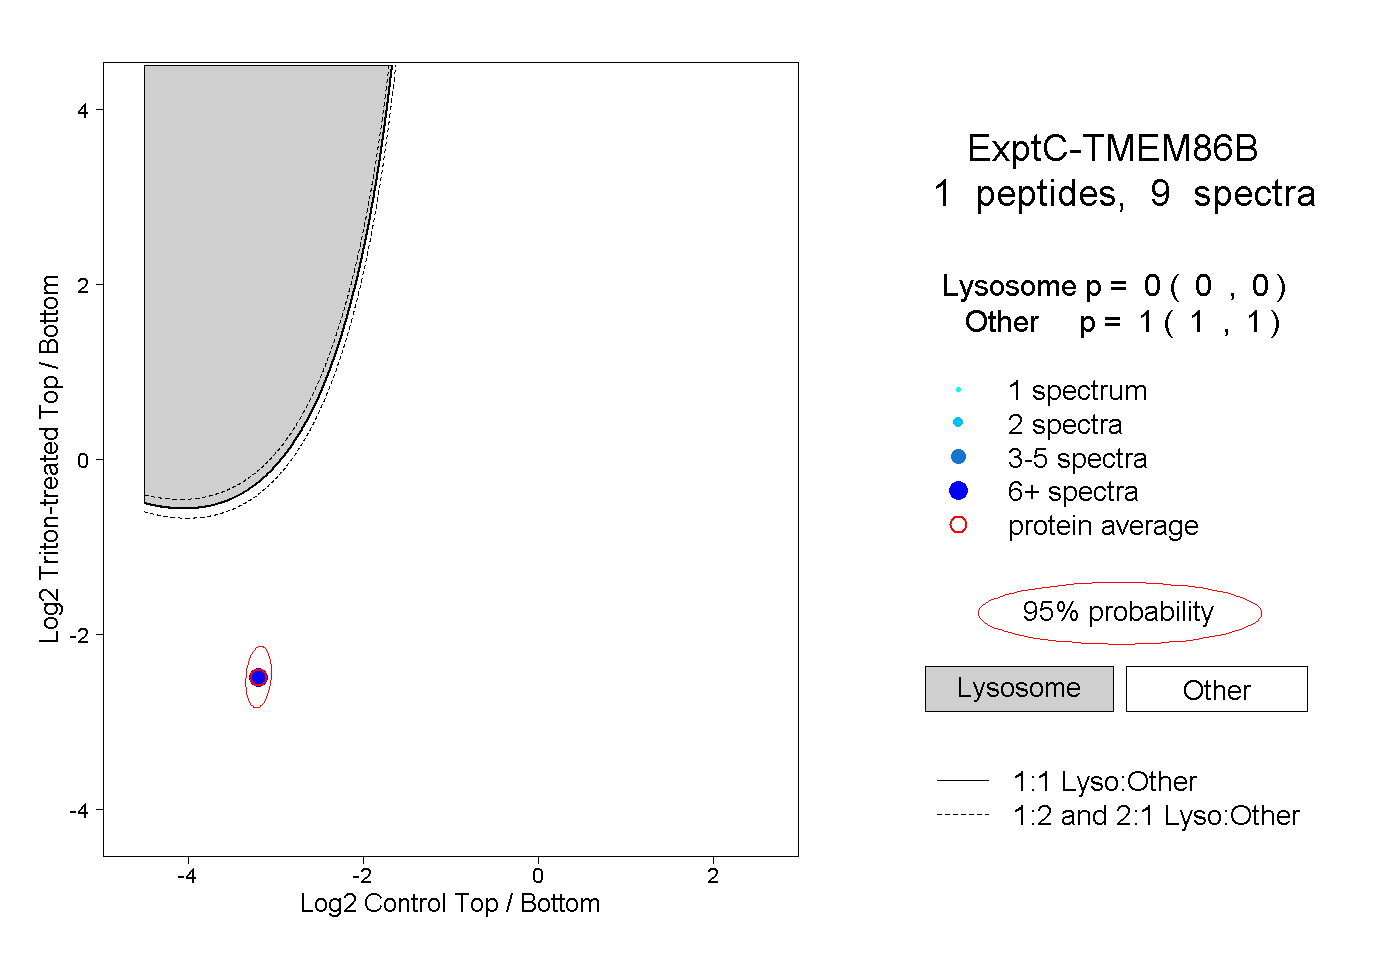
0.000 | 0.000
1.000 | 1.000
1peptide
spectra
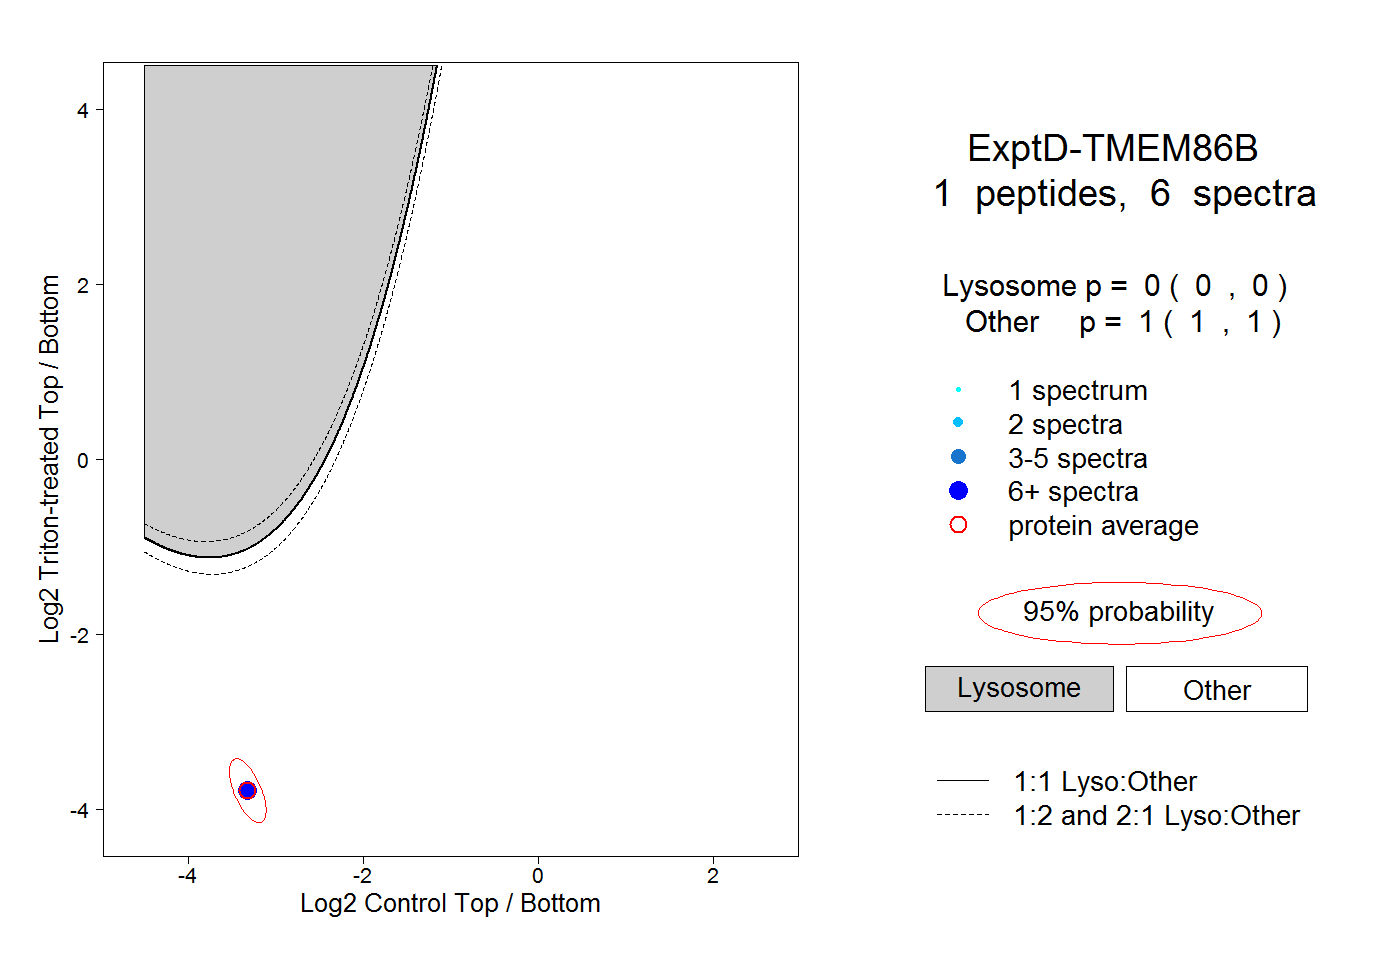
0.000 | 0.000
1.000 | 1.000