 2
2peptides
spectra
0.000 | 0.023
0.000 | 0.000
0.000 | 0.053
0.000 | 0.044
0.000 | 0.066
0.247 | 0.377
0.557 | 0.682
0.000 | 0.054
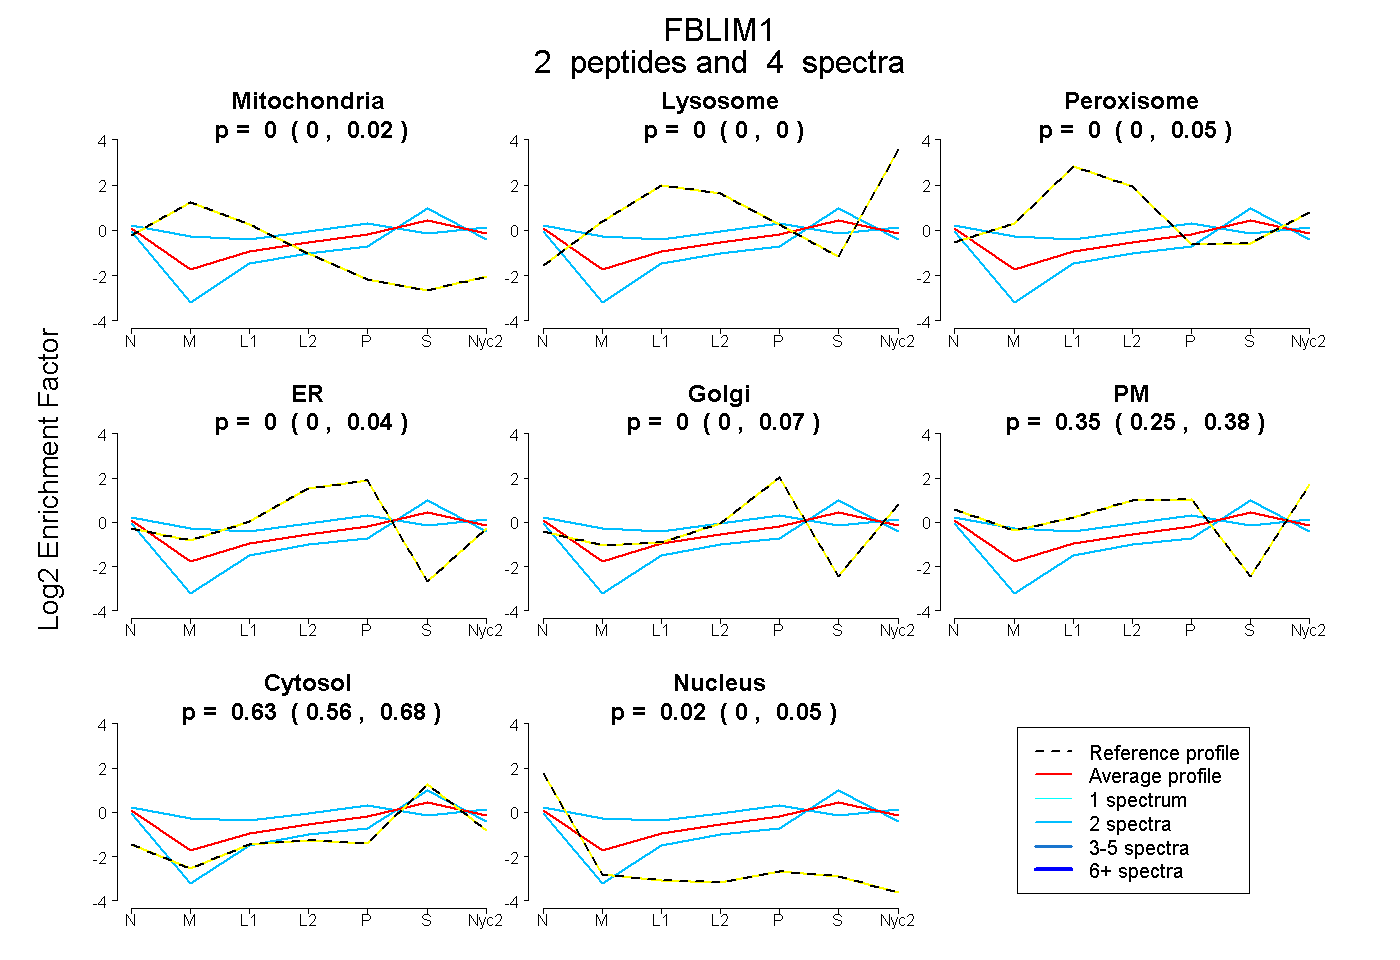
| Plot | Mito | Lyso | Perox | ER | Golgi | PM | Cytosol | Nucleus | |||||
| Expt A |
2 peptides |
4 spectra |
|
0.000 0.000 | 0.023 |
0.000 0.000 | 0.000 |
0.000 0.000 | 0.053 |
0.000 0.000 | 0.044 |
0.000 0.000 | 0.066 |
0.349 0.247 | 0.377 |
0.630 0.557 | 0.682 |
0.021 0.000 | 0.054 |