 2
2peptides
spectra
0.000 | 0.000
0.000 | 0.000
0.000 | 0.000
0.000 | 0.127
0.000 | 0.200
0.000 | 0.000
0.021 | 0.103
0.728 | 0.831
1peptide
spectra
NA | NA
NA | NA
NA | NA
NA | NA
NA | NA
NA | NA
NA | NA
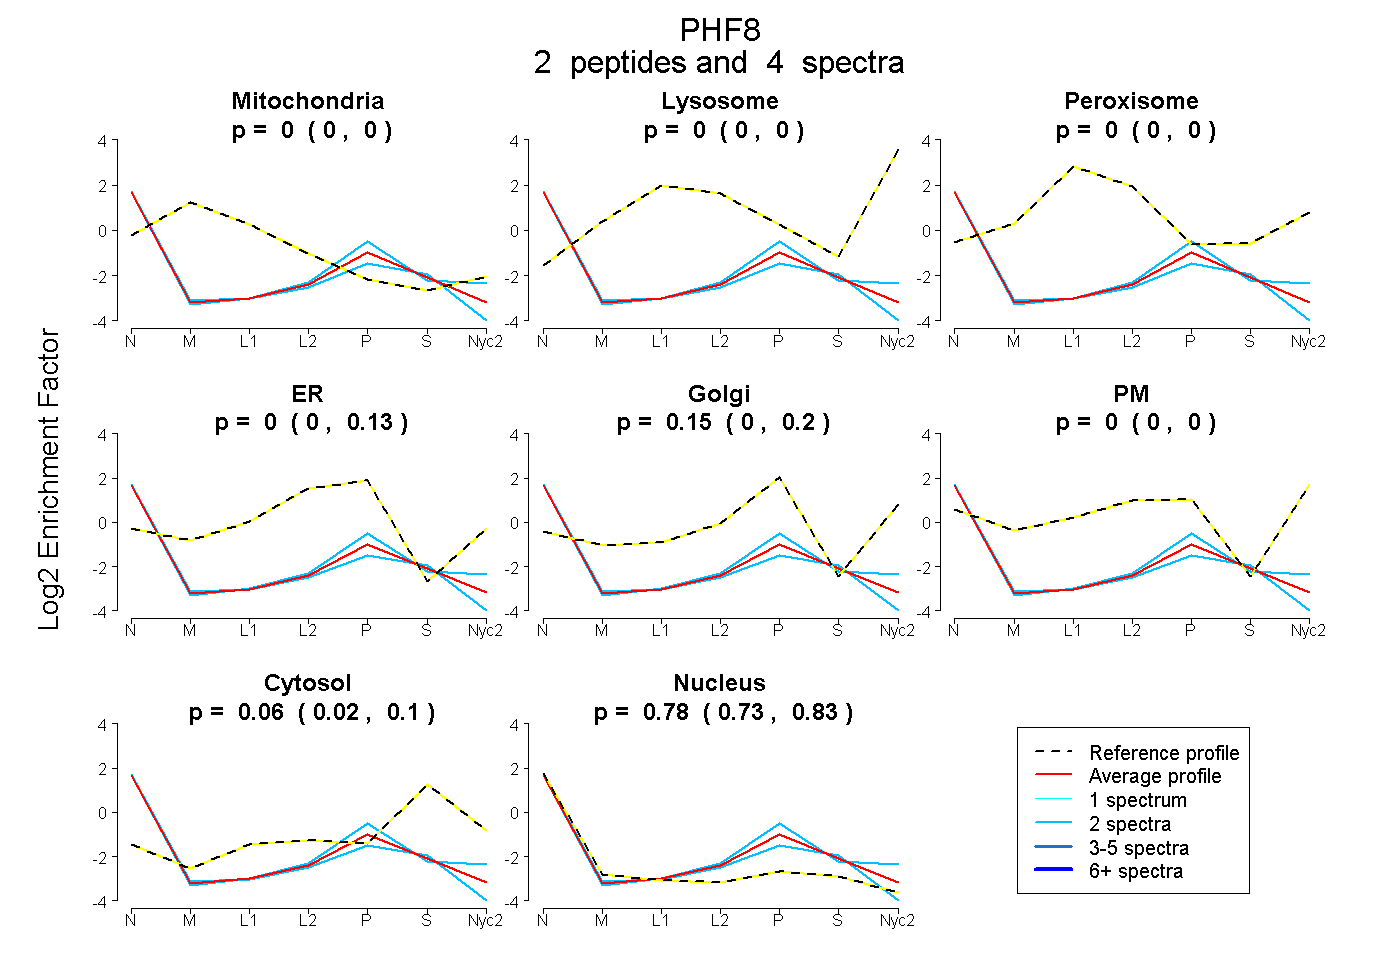
| Plot | Mito | Lyso | Perox | ER | Golgi | PM | Cytosol | Nucleus | |||||
| Expt A |
2 peptides |
4 spectra |
|
0.000 0.000 | 0.000 |
0.000 0.000 | 0.000 |
0.000 0.000 | 0.000 |
0.002 0.000 | 0.127 |
0.150 0.000 | 0.200 |
0.000 0.000 | 0.000 |
0.064 0.021 | 0.103 |
0.783 0.728 | 0.831 |
||
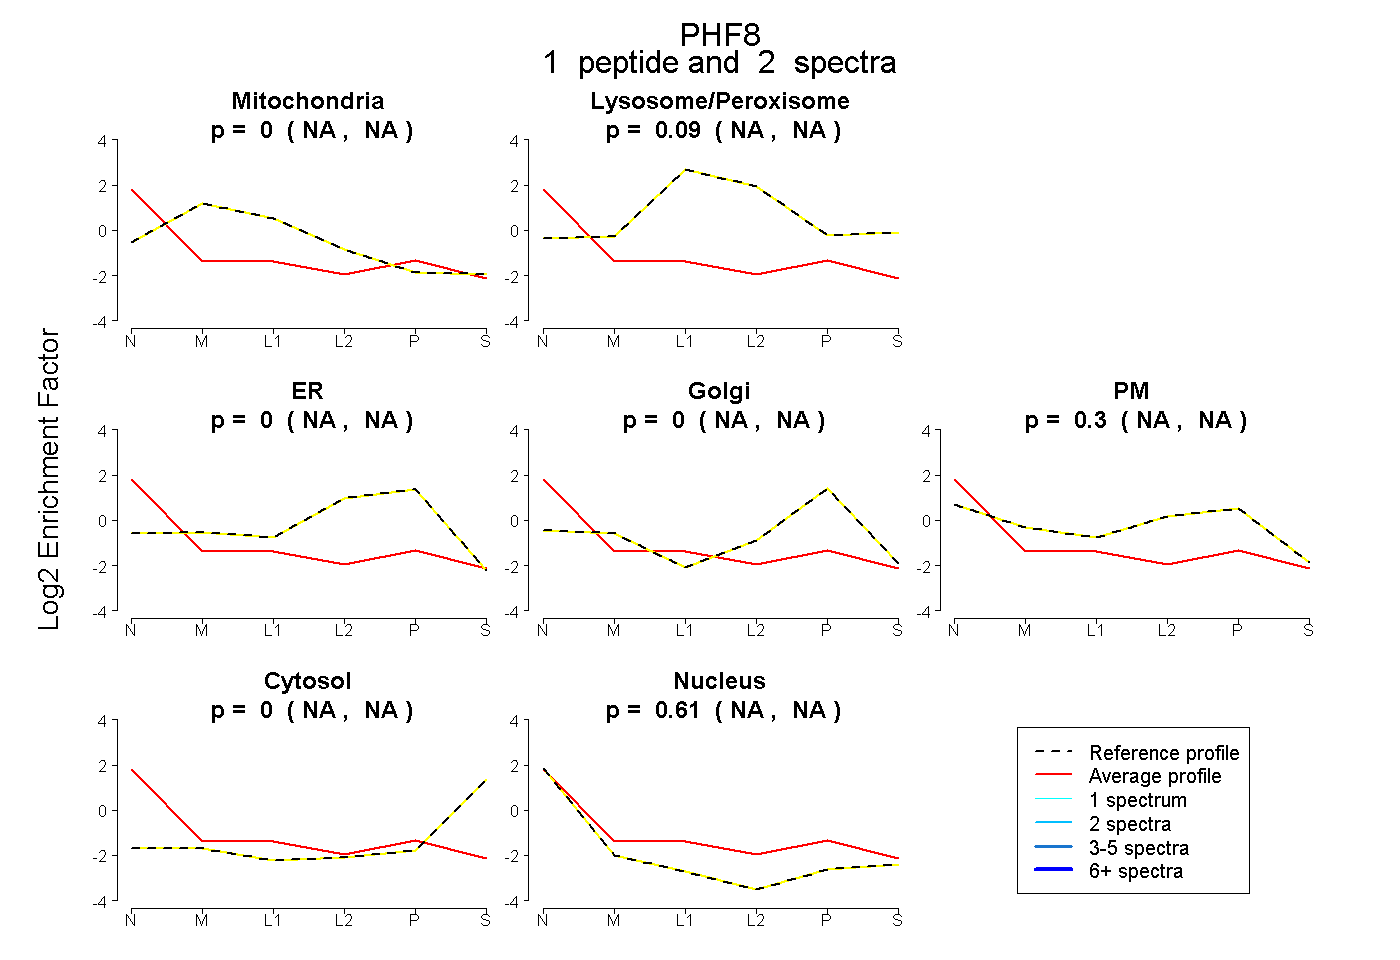
| Plot | Mito | Lyso or Perox | ER | Golgi | PM | Cytosol | Nucleus | ||||||
| Expt B |
1 peptide |
2 spectra |
|
0.000 NA | NA |
0.092 NA | NA |
0.000 NA | NA |
0.000 NA | NA |
0.298 NA | NA |
0.000 NA | NA |
0.610 NA | NA |