 14
14peptides
spectra
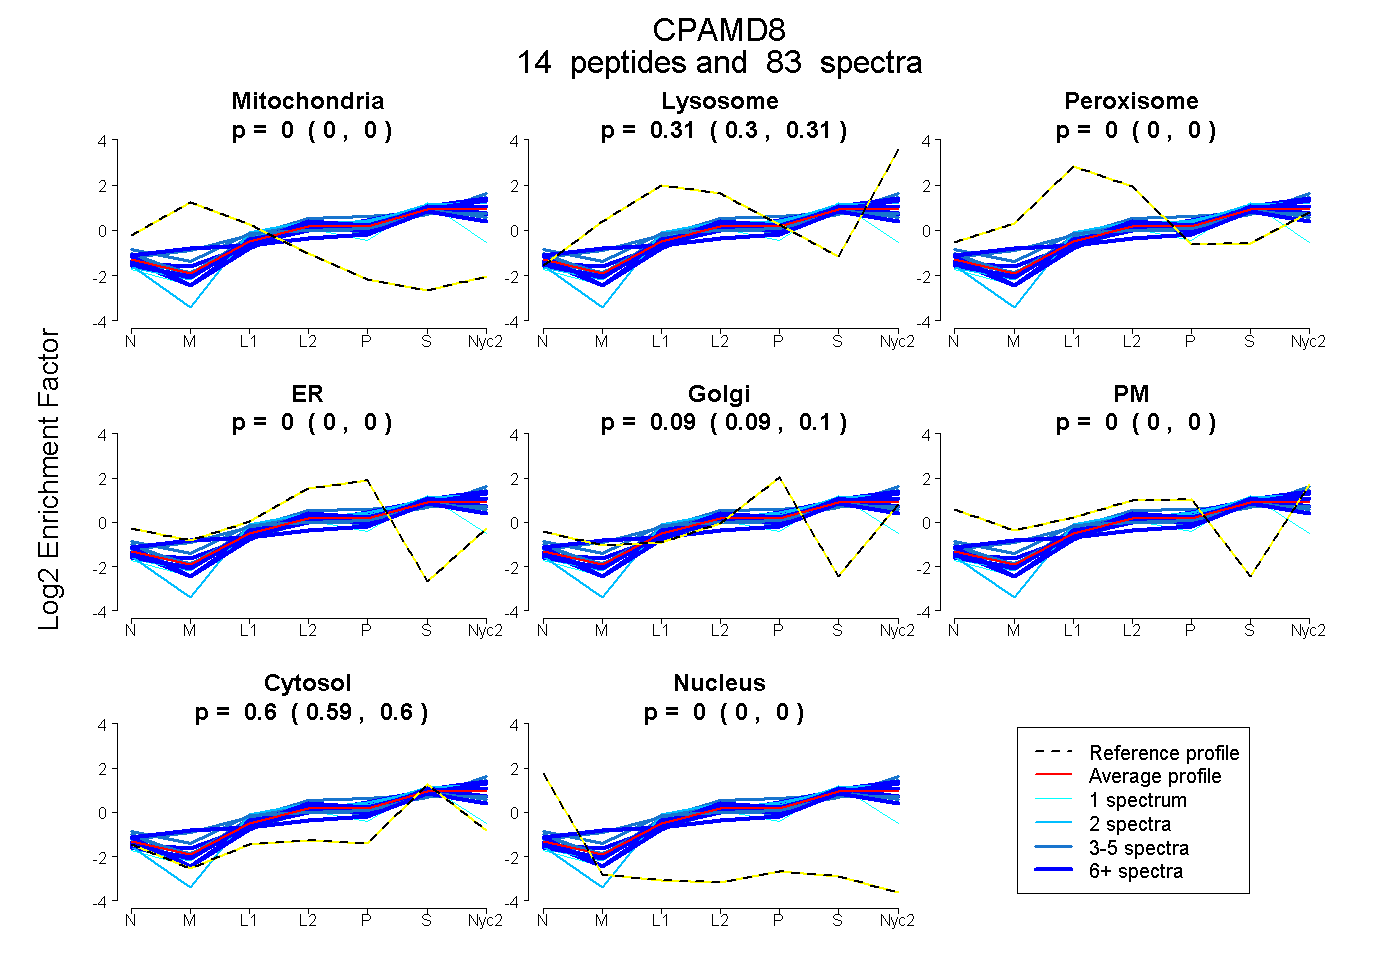
0.000 | 0.000
0.304 | 0.312
0.000 | 0.000
0.000 | 0.000
0.091 | 0.097
0.000 | 0.000
0.594 | 0.600
0.000 | 0.000
| Plot | Mito | Lyso | Perox | ER | Golgi | PM | Cytosol | Nucleus | |||||
| Expt A |
14 peptides |
83 spectra |
|
0.000 0.000 | 0.000 |
0.309 0.304 | 0.312 |
0.000 0.000 | 0.000 |
0.000 0.000 | 0.000 |
0.094 0.091 | 0.097 |
0.000 0.000 | 0.000 |
0.597 0.594 | 0.600 |
0.000 0.000 | 0.000 |
| 7 spectra, YNVPLEK | 0.000 | 0.235 | 0.043 | 0.000 | 0.111 | 0.000 | 0.612 | 0.000 | ||
| 10 spectra, ETGLMAFTNLK | 0.000 | 0.324 | 0.000 | 0.000 | 0.108 | 0.000 | 0.568 | 0.000 | ||
| 5 spectra, TPSVTVQSSGSFSQK | 0.000 | 0.247 | 0.080 | 0.000 | 0.113 | 0.022 | 0.538 | 0.000 | ||
| 2 spectra, HAEAHHTAYAVYSLSK | 0.000 | 0.289 | 0.000 | 0.053 | 0.049 | 0.000 | 0.608 | 0.000 | ||
| 12 spectra, SSGSLLNNAMK | 0.000 | 0.352 | 0.000 | 0.000 | 0.072 | 0.000 | 0.575 | 0.000 | ||
| 5 spectra, GDPIPNEQVLIK | 0.000 | 0.267 | 0.000 | 0.000 | 0.093 | 0.000 | 0.640 | 0.000 | ||
| 8 spectra, LGHVSR | 0.000 | 0.377 | 0.000 | 0.000 | 0.012 | 0.000 | 0.611 | 0.000 | ||
| 5 spectra, ALMAYAFALAGNQEK | 0.000 | 0.361 | 0.000 | 0.000 | 0.151 | 0.000 | 0.488 | 0.000 | ||
| 1 spectrum, DLFHCVSFTIPR | 0.000 | 0.049 | 0.076 | 0.097 | 0.000 | 0.000 | 0.778 | 0.000 | ||
| 5 spectra, IMQWQDVK | 0.000 | 0.464 | 0.000 | 0.000 | 0.076 | 0.000 | 0.460 | 0.000 | ||
| 10 spectra, SPLPQEPPR | 0.000 | 0.239 | 0.000 | 0.041 | 0.050 | 0.000 | 0.669 | 0.000 | ||
| 8 spectra, GMYESLPVVAVK | 0.000 | 0.224 | 0.000 | 0.000 | 0.151 | 0.000 | 0.625 | 0.000 | ||
| 2 spectra, MLIYTILPDGEVIADSVK | 0.000 | 0.326 | 0.000 | 0.000 | 0.028 | 0.000 | 0.646 | 0.000 | ||
| 3 spectra, ISLCHGNPTFSSETK | 0.000 | 0.258 | 0.000 | 0.088 | 0.043 | 0.000 | 0.611 | 0.000 |
| Plot | Mito | Lyso or Perox | ER | Golgi | PM | Cytosol | Nucleus | ||||||
| Expt B |
33 peptides |
145 spectra |
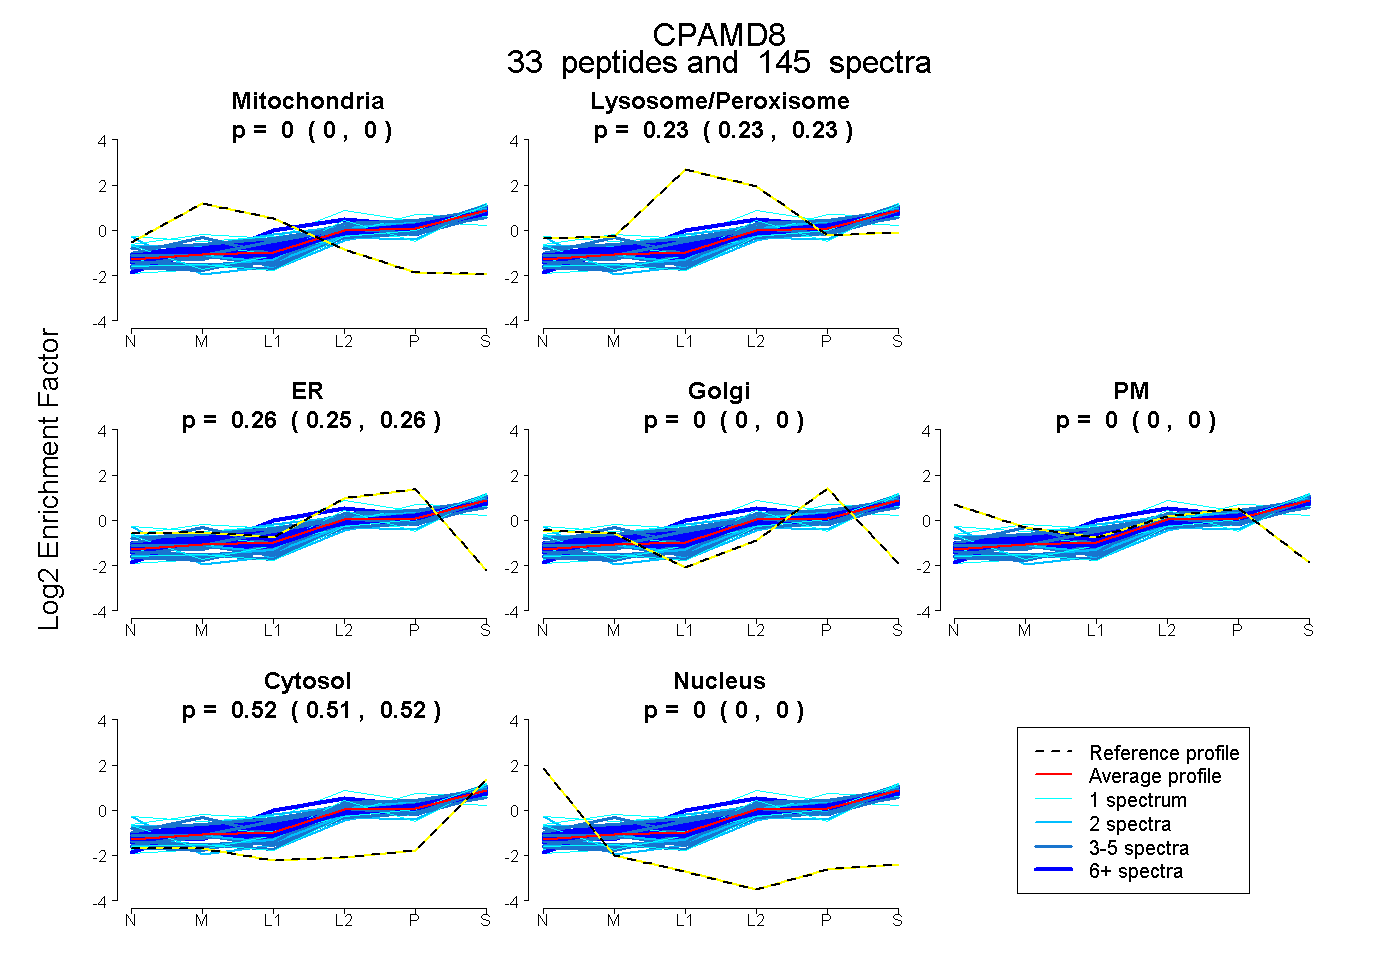 |
0.000 0.000 | 0.000 |
0.228 0.225 | 0.230 |
0.256 0.254 | 0.258 |
0.000 0.000 | 0.000 |
0.000 0.000 | 0.000 |
0.516 0.515 | 0.517 |
0.000 0.000 | 0.000 |
|||
| Plot | Lyso | Other | |||||||||||
| Expt C |
37 peptides |
659 spectra |
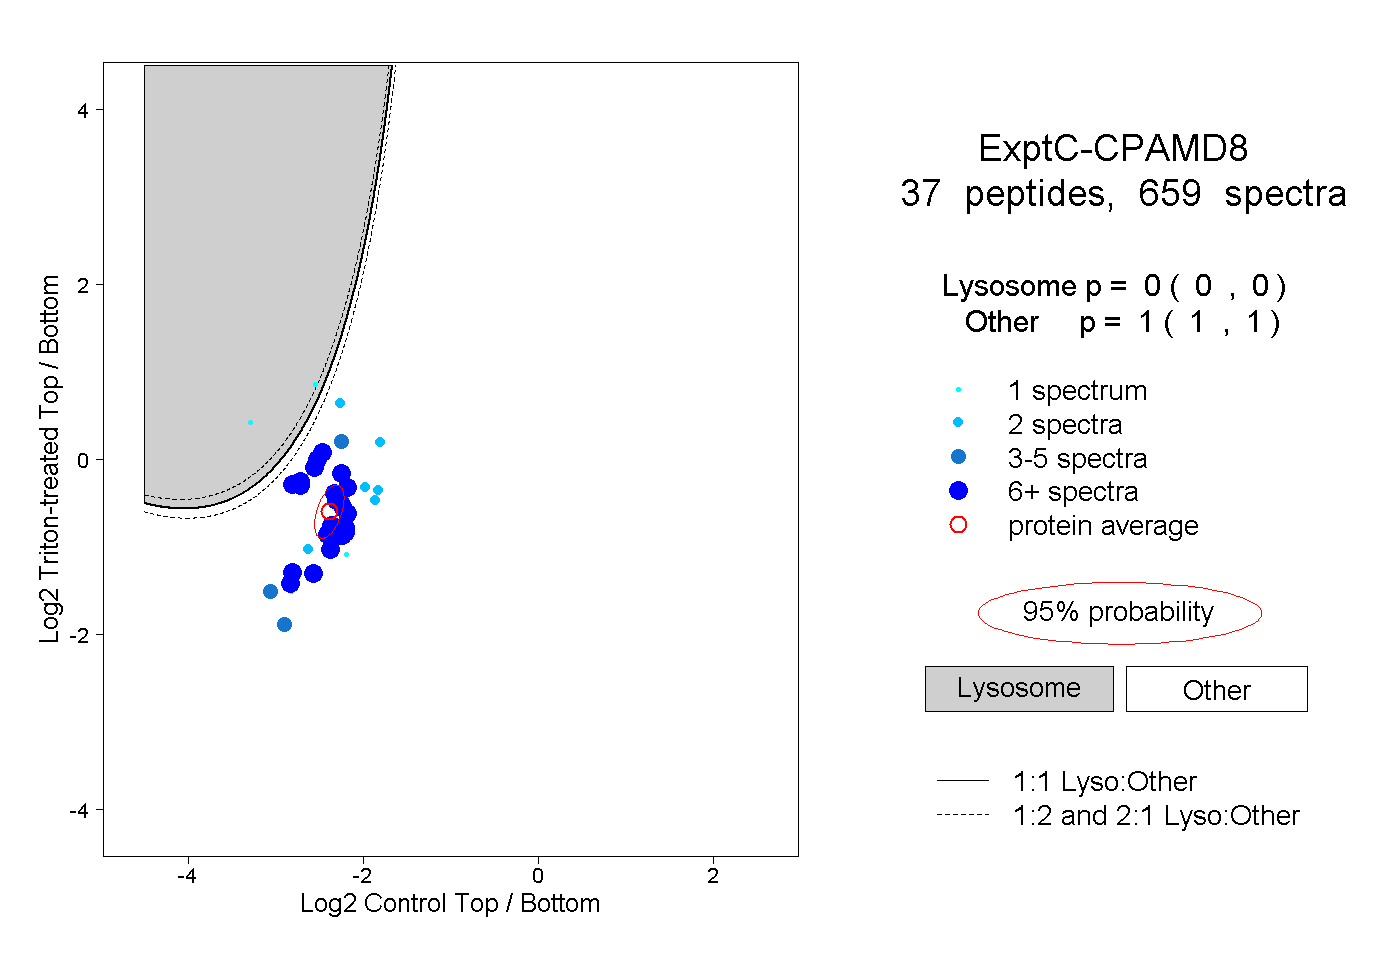 |
0.000 0.000 | 0.000 |
1.000 1.000 | 1.000 |
||||||||
| Plot | Lyso | Other | |||||||||||
| Expt D |
6 peptides |
8 spectra |
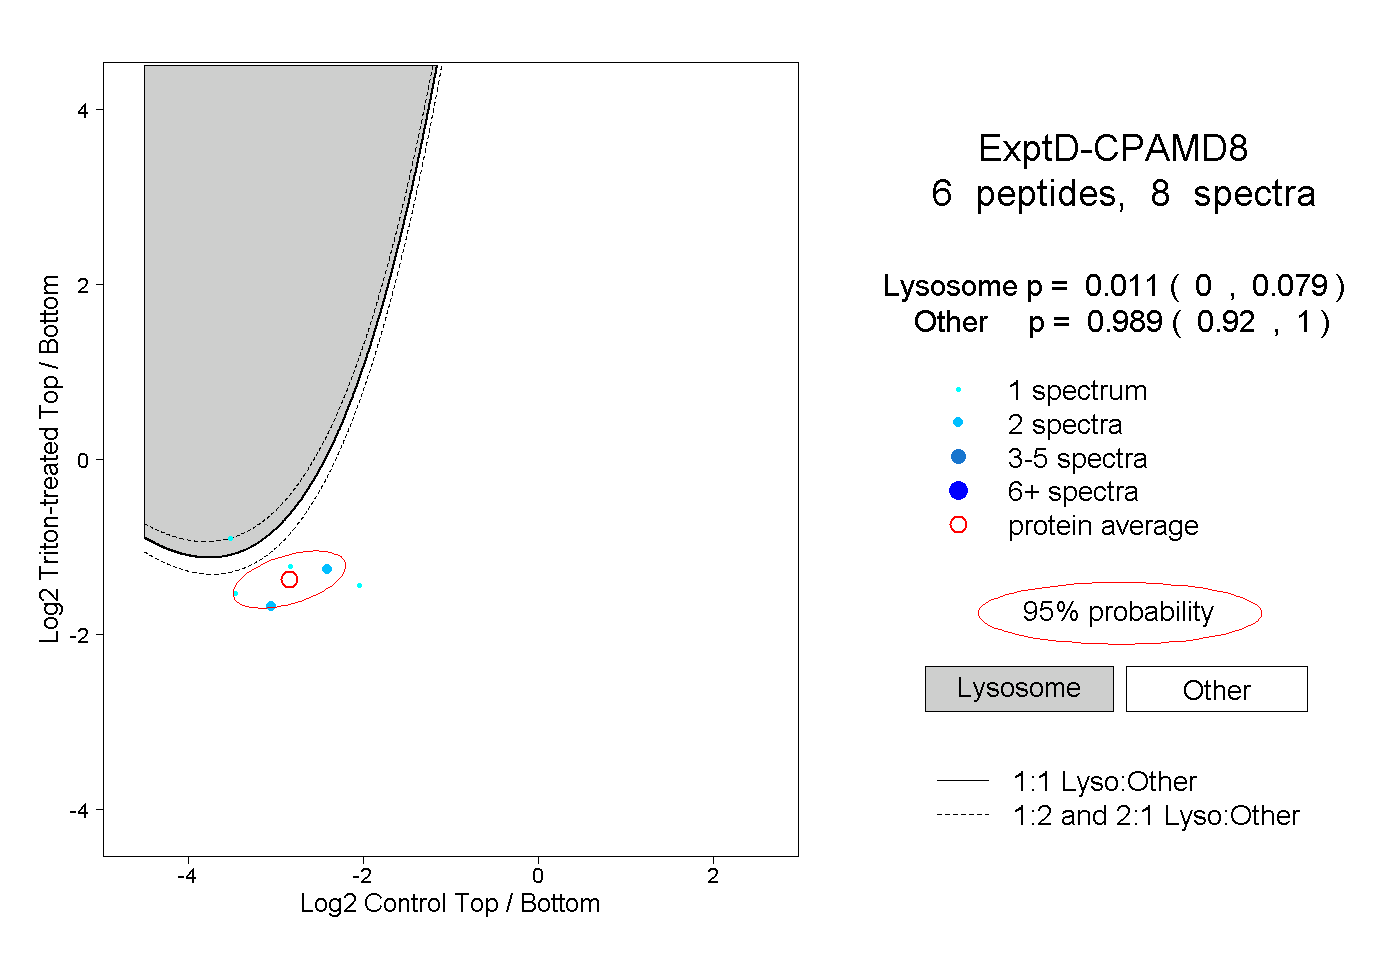 |
0.011 0.000 | 0.079 |
0.989 0.920 | 1.000 |