 3
3peptides
spectra
0.039 | 0.172
0.000 | 0.000
0.000 | 0.005
0.000 | 0.043
0.000 | 0.012
0.000 | 0.013
0.775 | 0.891
0.000 | 0.076
1peptide
spectrum
NA | NA
NA | NA
| Plot | Mito | Lyso | Perox | ER | Golgi | PM | Cytosol | Nucleus | |||||
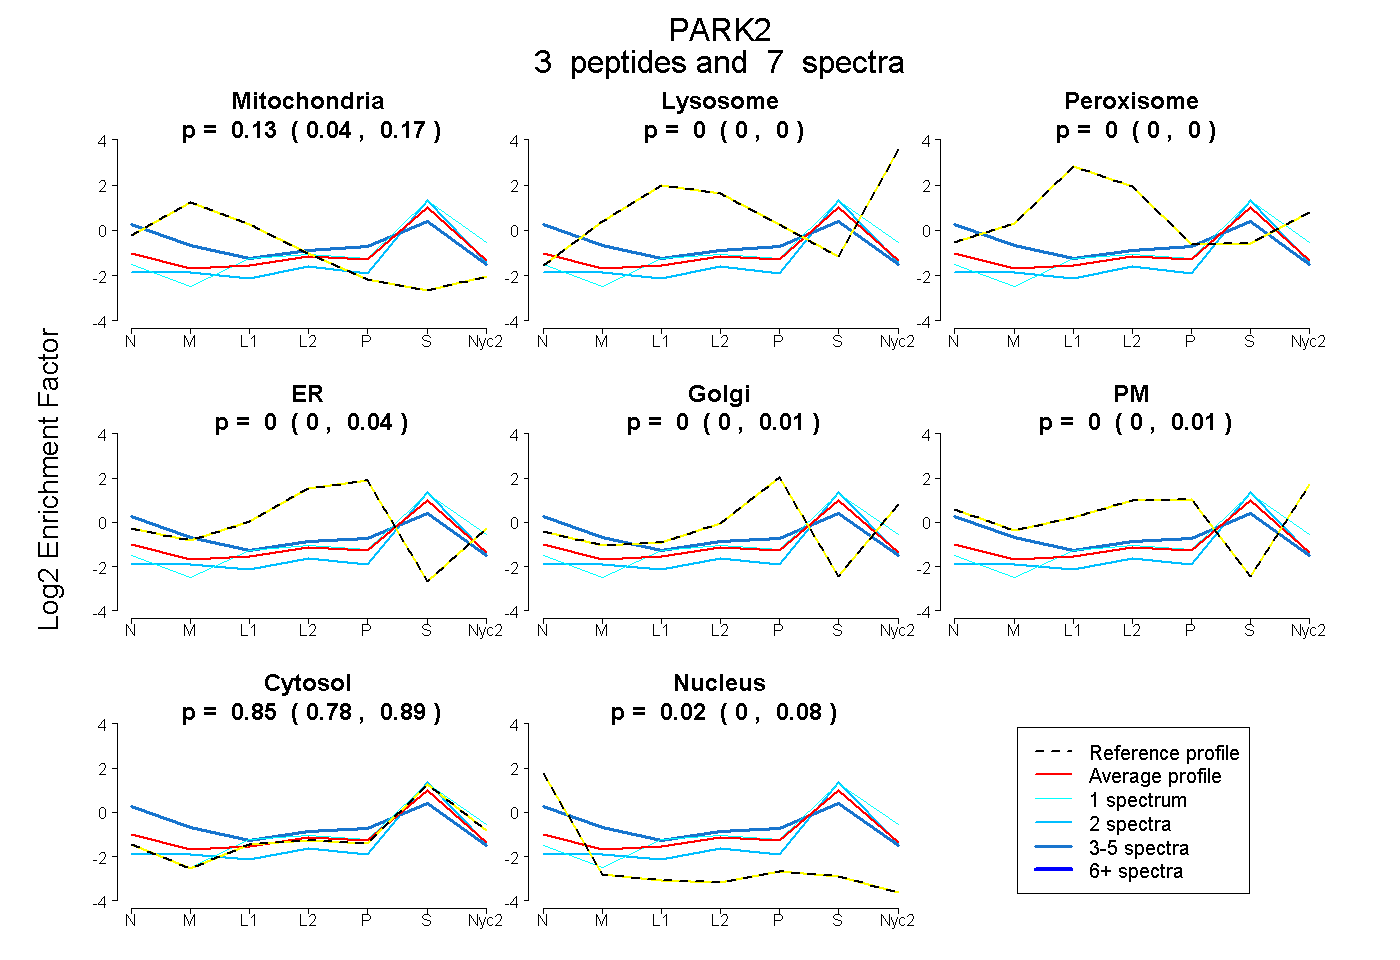
| Expt A |
3 peptides |
7 spectra |
|
0.132 0.039 | 0.172 |
0.000 0.000 | 0.000 |
0.000 0.000 | 0.005 |
0.002 0.000 | 0.043 |
0.000 0.000 | 0.012 |
0.000 0.000 | 0.013 |
0.850 0.775 | 0.891 |
0.016 0.000 | 0.076 |
||
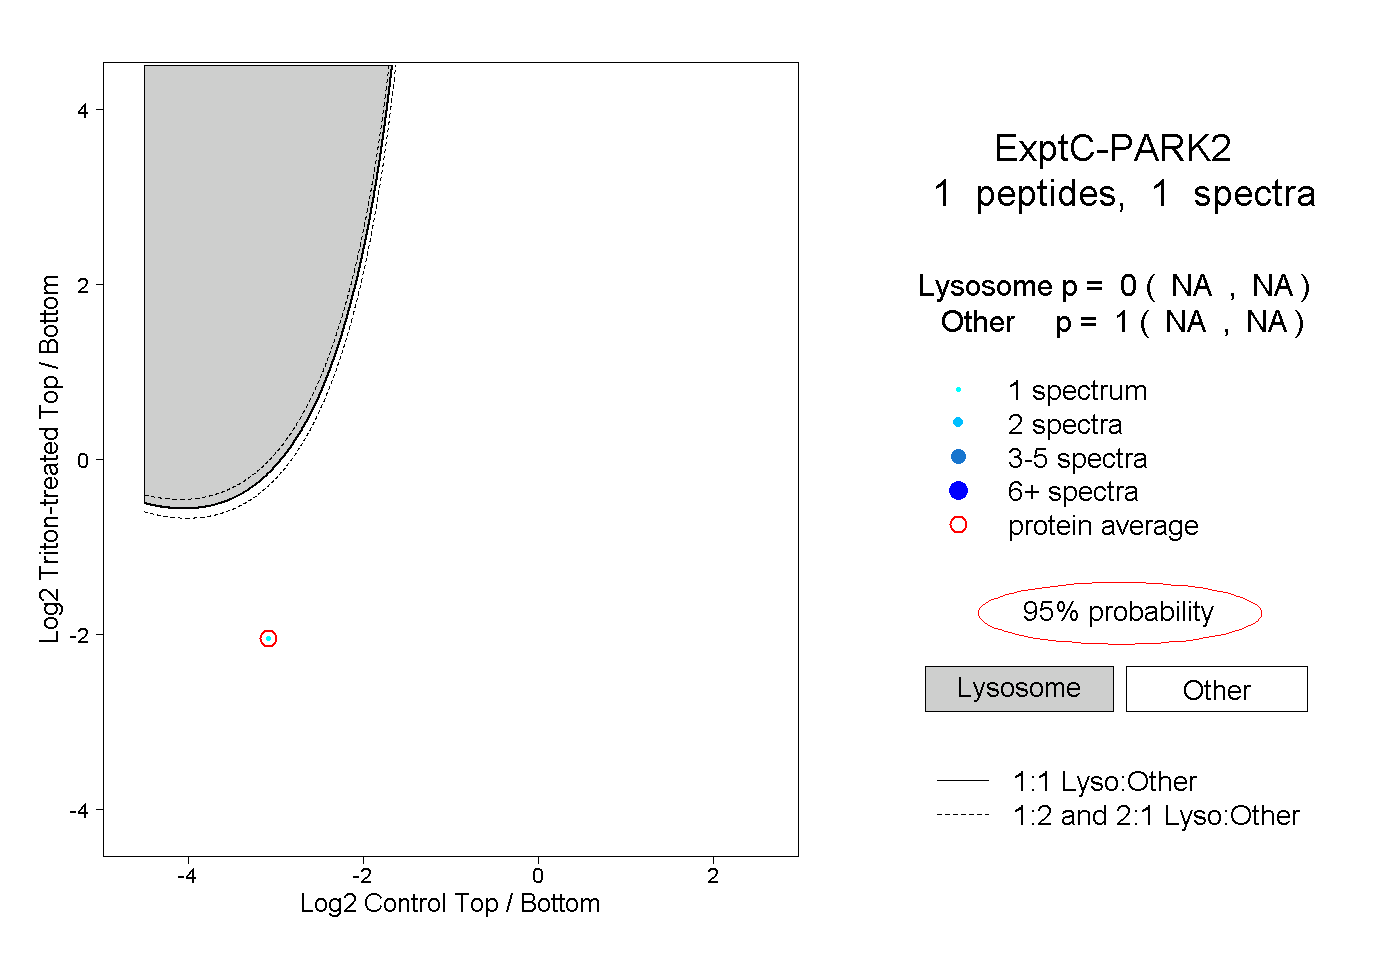
| Plot | Lyso | Other | |||||||||||
| Expt C |
1 peptide |
1 spectrum |
|
0.000 NA | NA |
1.000 NA | NA |