 6
6peptides
spectra
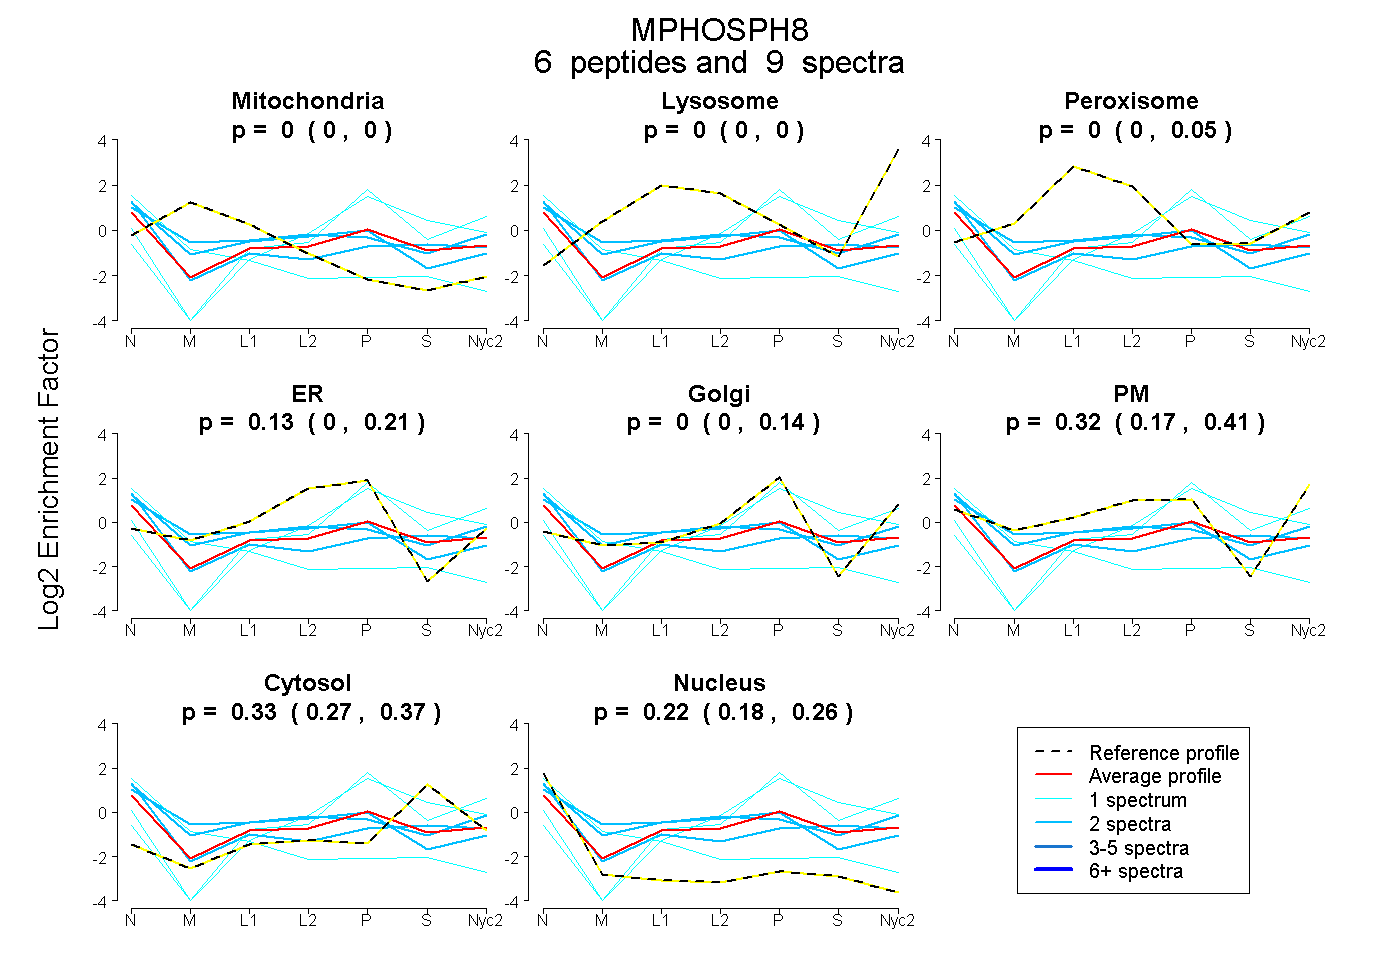
0.000 | 0.000
0.000 | 0.000
0.000 | 0.048
0.000 | 0.209
0.000 | 0.137
0.171 | 0.407
0.271 | 0.371
0.181 | 0.257
| Plot | Mito | Lyso | Perox | ER | Golgi | PM | Cytosol | Nucleus | |||||
| Expt A |
6 peptides |
9 spectra |
|
0.000 0.000 | 0.000 |
0.000 0.000 | 0.000 |
0.000 0.000 | 0.048 |
0.125 0.000 | 0.209 |
0.000 0.000 | 0.137 |
0.323 0.171 | 0.407 |
0.332 0.271 | 0.371 |
0.220 0.181 | 0.257 |
| 1 spectrum, LTPELGLILK | 0.000 | 0.000 | 0.000 | 0.000 | 0.605 | 0.000 | 0.395 | 0.000 | ||
| 1 spectrum, DYEDGILHDNETNHEMK | 0.000 | 0.000 | 0.000 | 0.013 | 0.418 | 0.000 | 0.569 | 0.000 | ||
| 2 spectra, HLDGEDEPFITANR | 0.000 | 0.000 | 0.013 | 0.000 | 0.000 | 0.326 | 0.352 | 0.310 | ||
| 2 spectra, HLDDLISIEEAGTR | 0.035 | 0.000 | 0.176 | 0.000 | 0.000 | 0.428 | 0.152 | 0.209 | ||
| 2 spectra, VAEETIR | 0.000 | 0.000 | 0.184 | 0.213 | 0.000 | 0.236 | 0.016 | 0.351 | ||
| 1 spectrum, LLIGAYR | 0.297 | 0.000 | 0.122 | 0.000 | 0.000 | 0.000 | 0.000 | 0.582 |
| Plot | Lyso | Other | |||||||||||
| Expt C |
1 peptide |
1 spectrum |
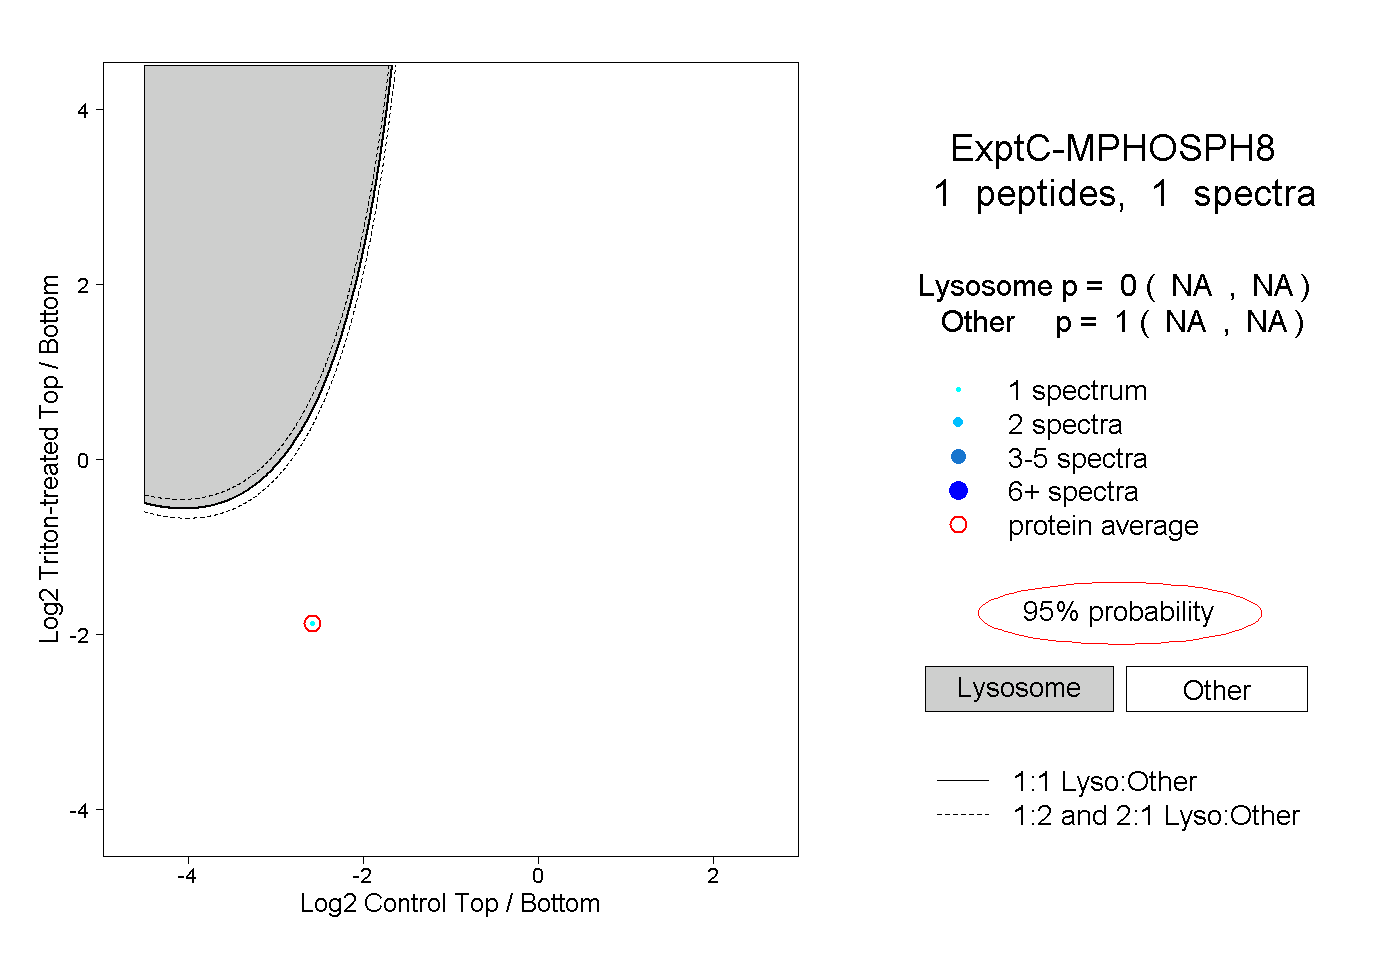 |
0.000 NA | NA |
1.000 NA | NA |