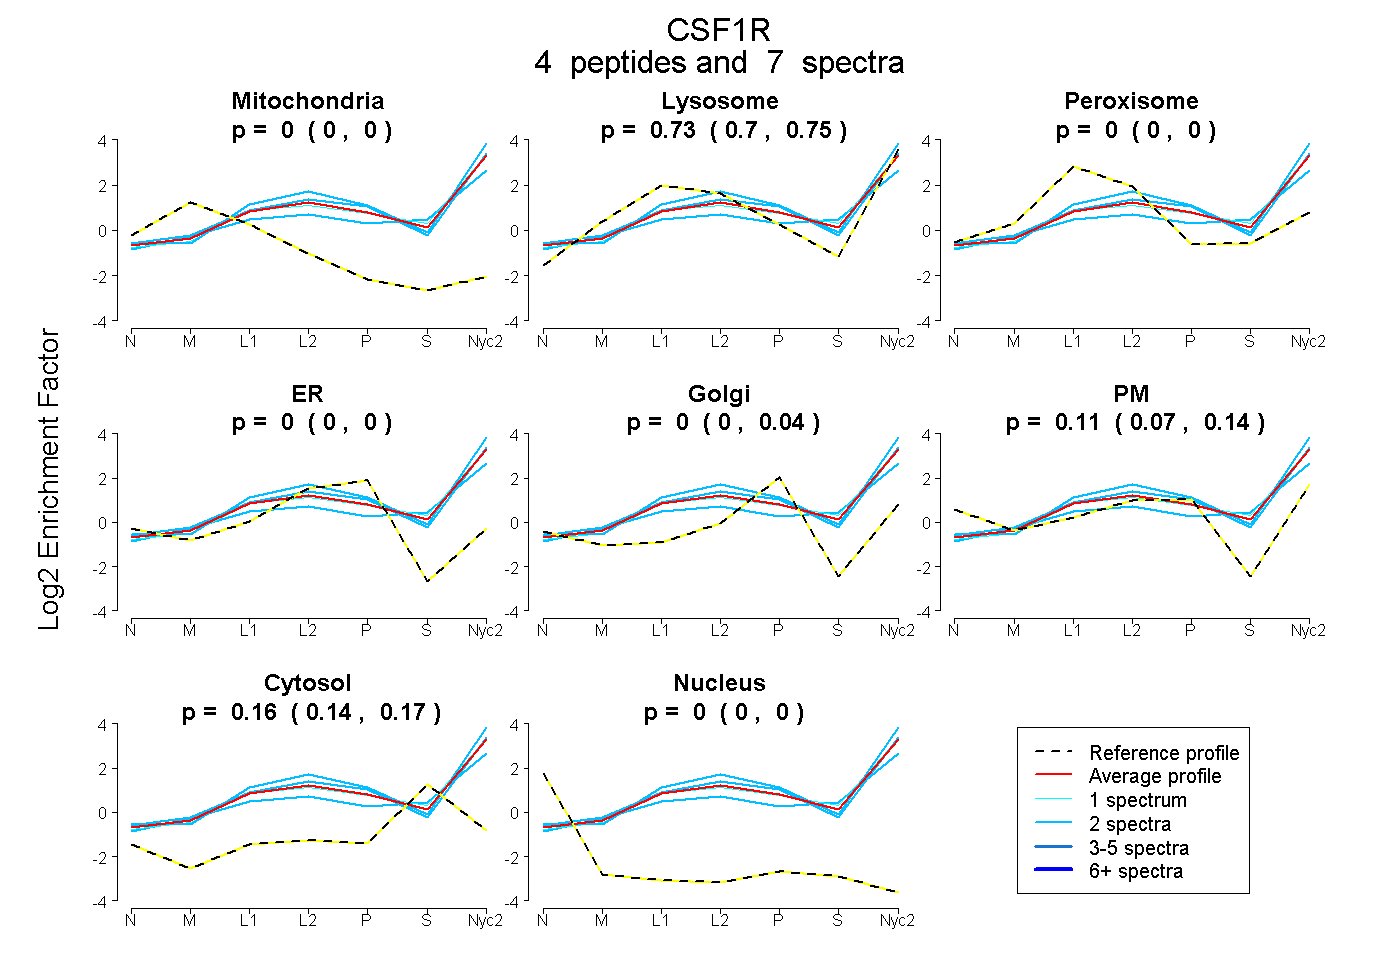
 4
4peptides
spectra
0.000 | 0.000
0.697 | 0.754
0.000 | 0.000
0.000 | 0.000
0.000 | 0.038
0.073 | 0.135
0.136 | 0.174
0.000 | 0.000
| Plot | Mito | Lyso | Perox | ER | Golgi | PM | Cytosol | Nucleus | |||||
| Expt A |
4 peptides |
7 spectra |
|
0.000 0.000 | 0.000 |
0.726 0.697 | 0.754 |
0.000 0.000 | 0.000 |
0.000 0.000 | 0.000 |
0.000 0.000 | 0.038 |
0.115 0.073 | 0.135 |
0.159 0.136 | 0.174 |
0.000 0.000 | 0.000 |
| 2 spectra, TVYSFLPWR | 0.000 | 0.784 | 0.000 | 0.000 | 0.000 | 0.159 | 0.057 | 0.000 | ||
| 2 spectra, VKPLEAGR | 0.000 | 0.714 | 0.000 | 0.000 | 0.046 | 0.158 | 0.082 | 0.000 | ||
| 1 spectrum, ESTSIGIR | 0.000 | 0.757 | 0.000 | 0.000 | 0.000 | 0.053 | 0.191 | 0.000 | ||
| 2 spectra, DSVSLVR | 0.000 | 0.666 | 0.000 | 0.000 | 0.000 | 0.031 | 0.302 | 0.000 |
| Plot | Lyso | Other | |||||||||||
| Expt C |
10 peptides |
15 spectra |
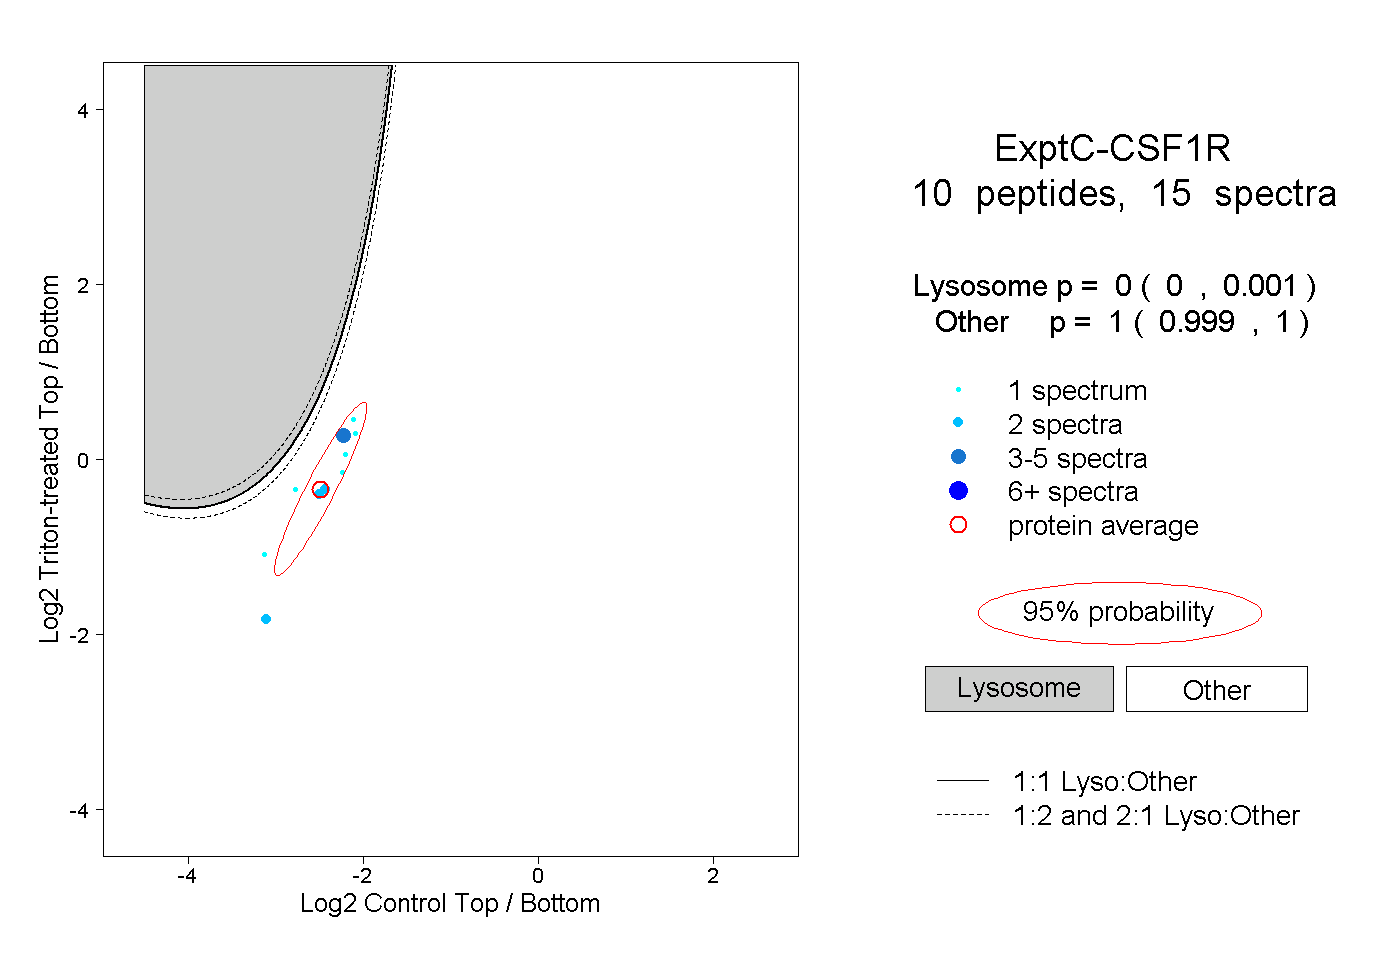 |
0.000 0.000 | 0.001 |
1.000 0.999 | 1.000 |