 4
4peptides
spectra
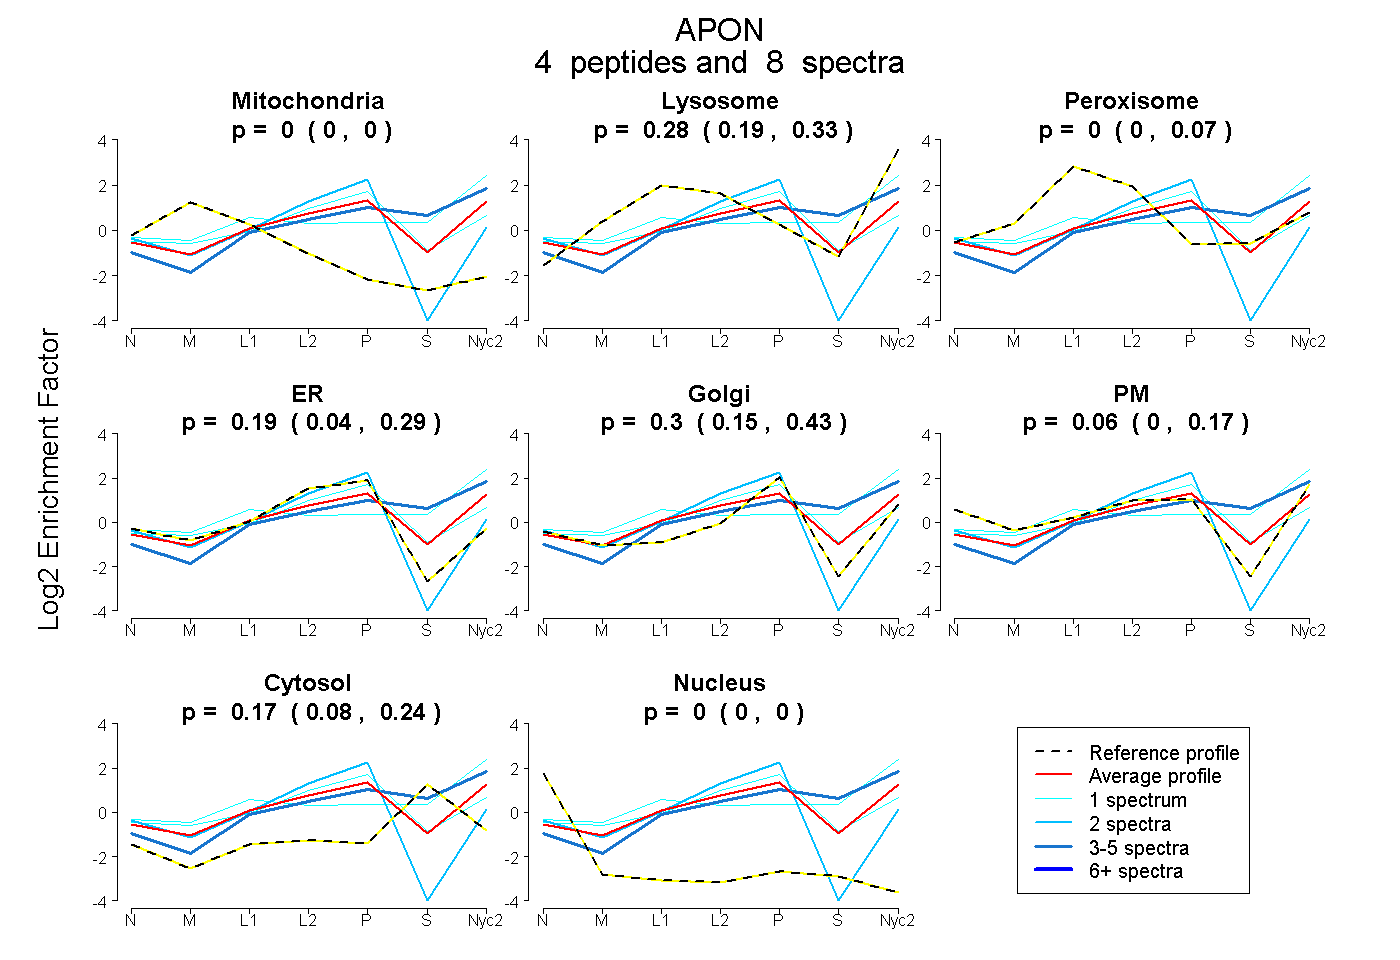
0.000 | 0.000
0.189 | 0.327
0.000 | 0.066
0.043 | 0.292
0.150 | 0.433
0.000 | 0.170
0.083 | 0.242
0.000 | 0.000
1peptide
spectrum
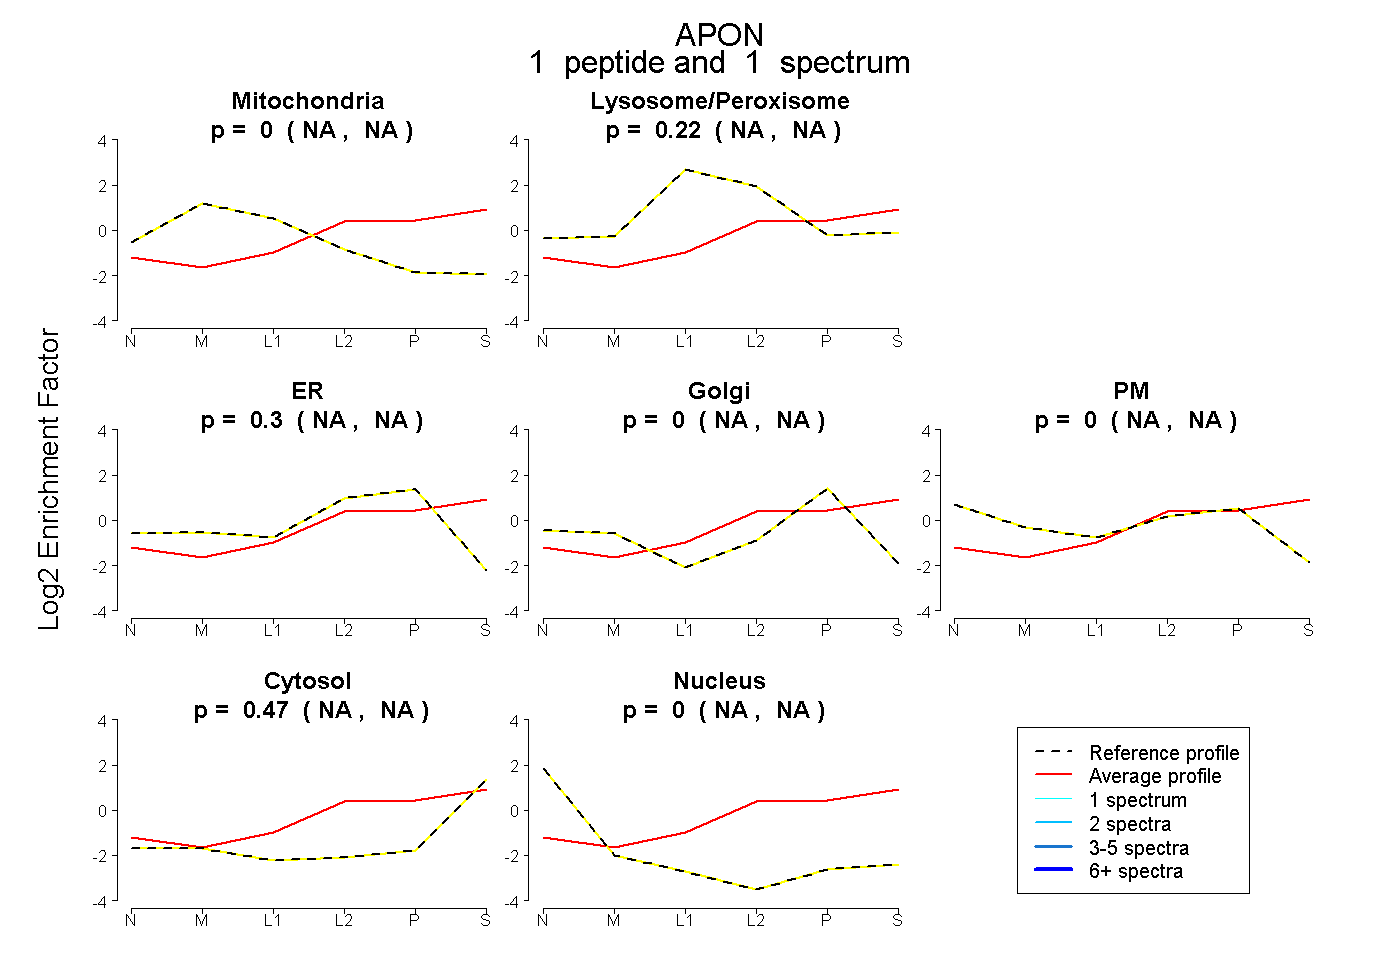
NA | NA
NA | NA
NA | NA
NA | NA
NA | NA
NA | NA
NA | NA
4peptides
spectra
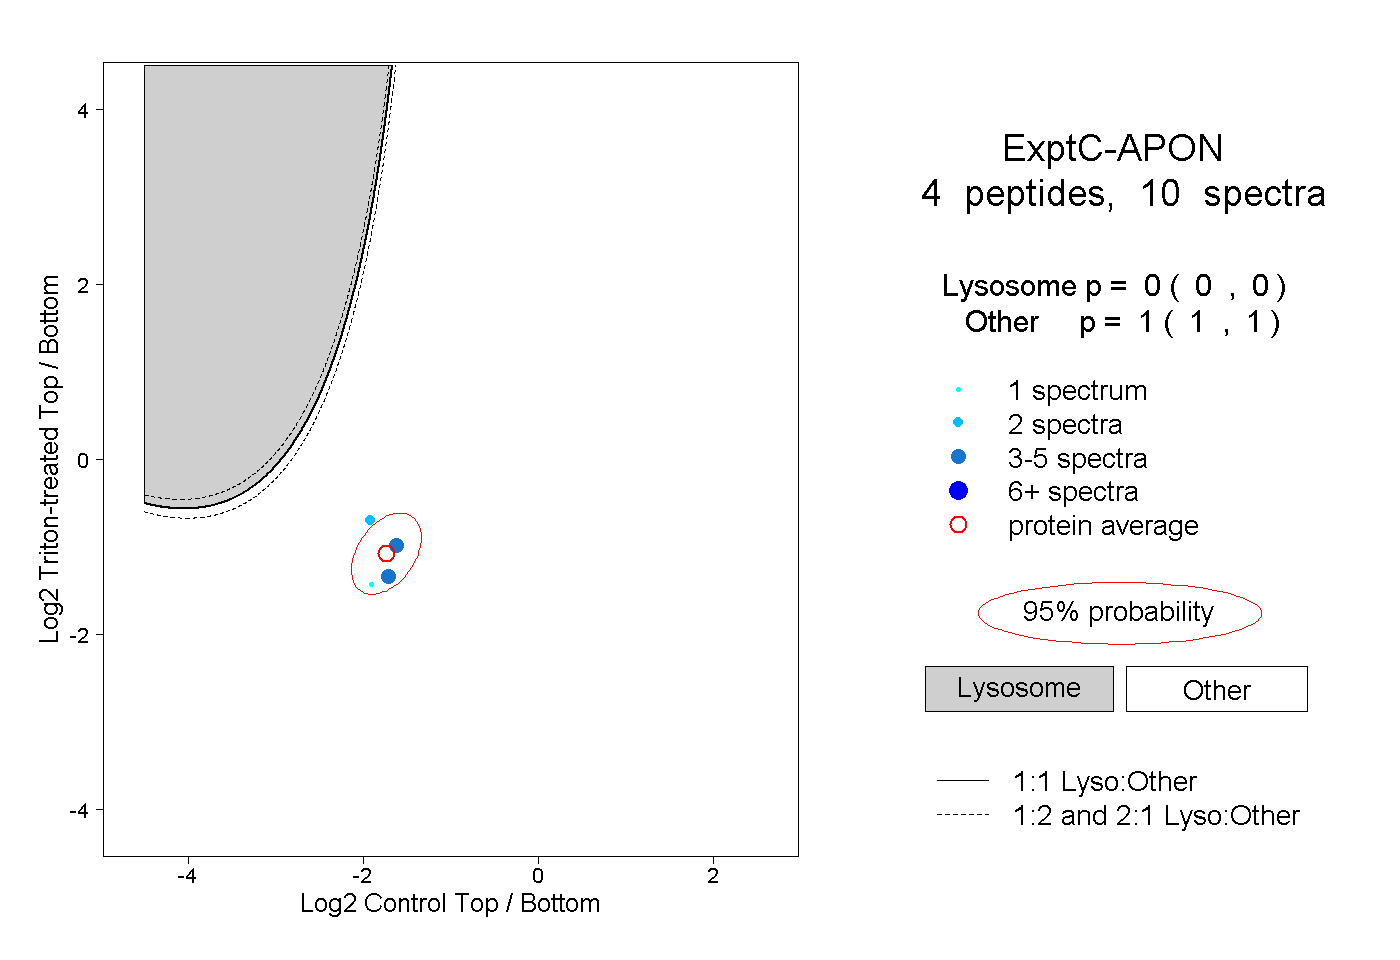
0.000 | 0.000
1.000 | 1.000
1peptide
spectra
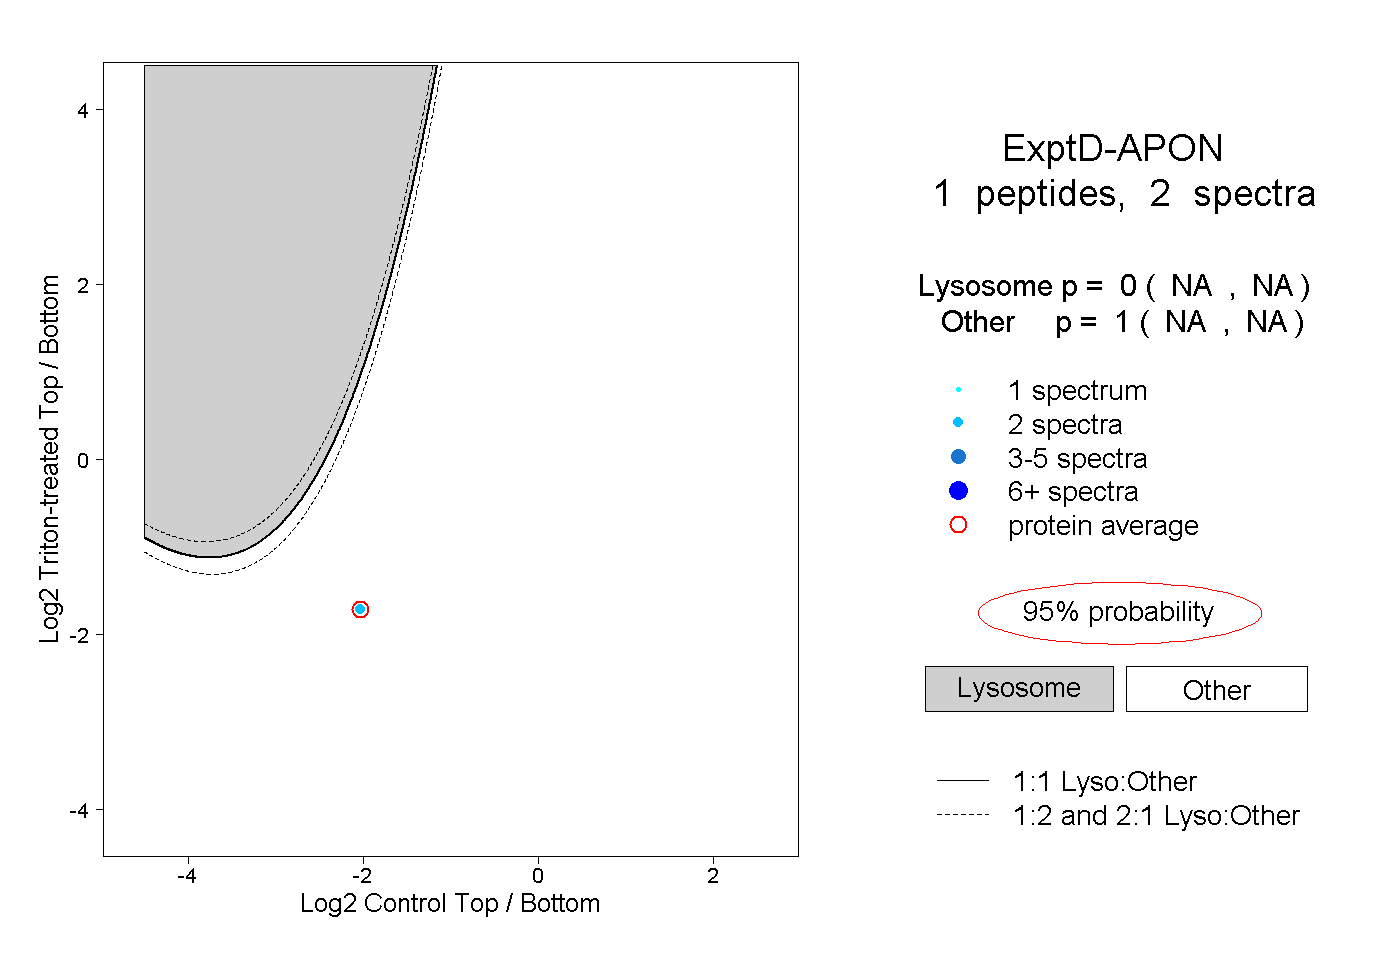
NA | NA
NA | NA