 10
10peptides
spectra
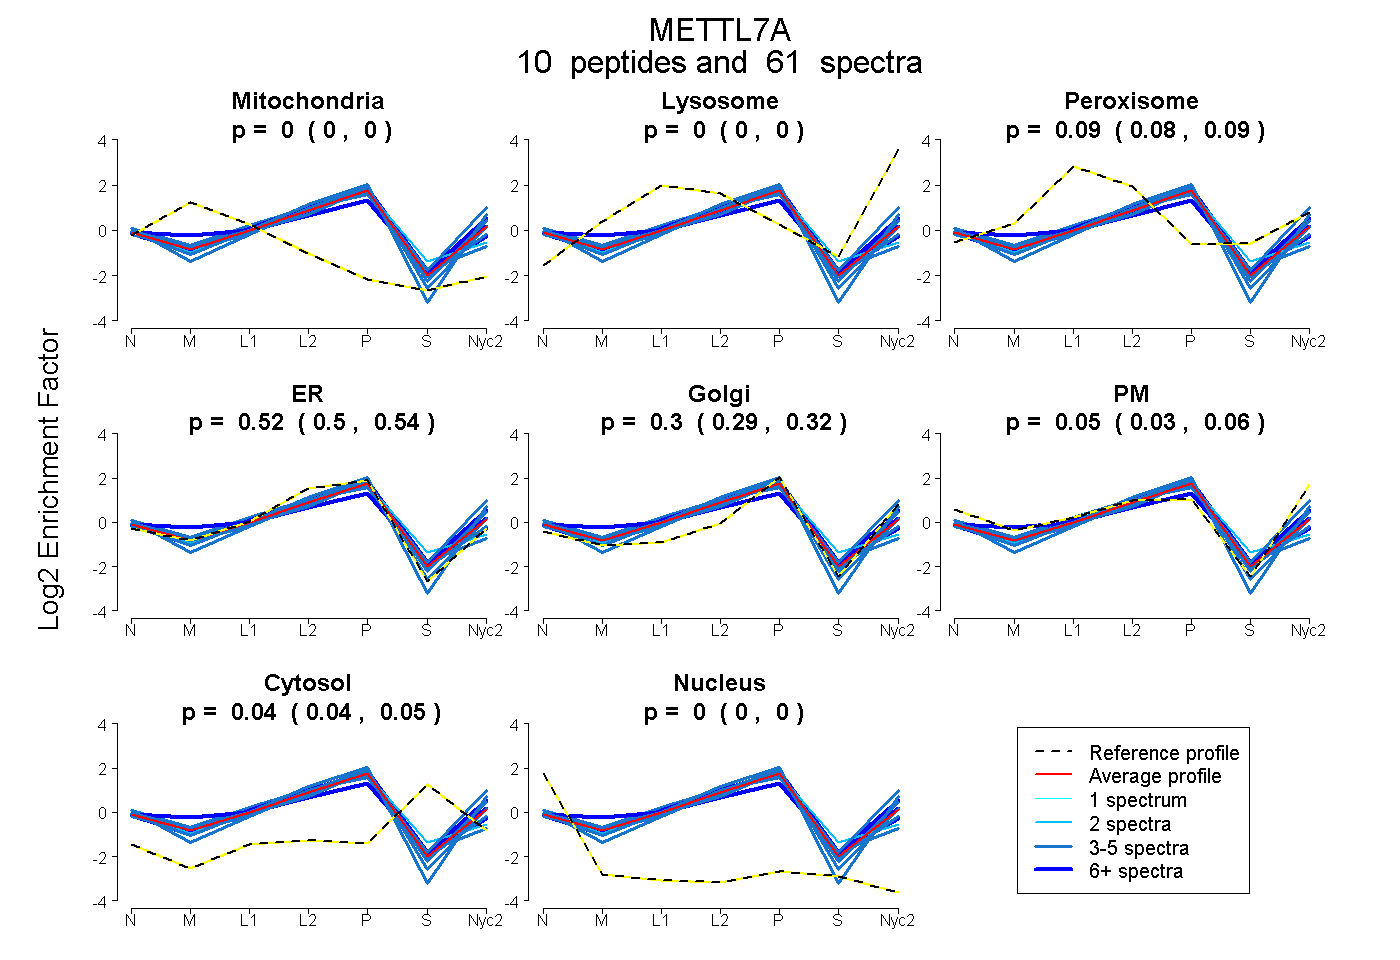
0.000 | 0.000
0.000 | 0.000
0.080 | 0.093
0.498 | 0.536
0.286 | 0.318
0.034 | 0.057
0.039 | 0.049
0.000 | 0.000
10peptides
spectra
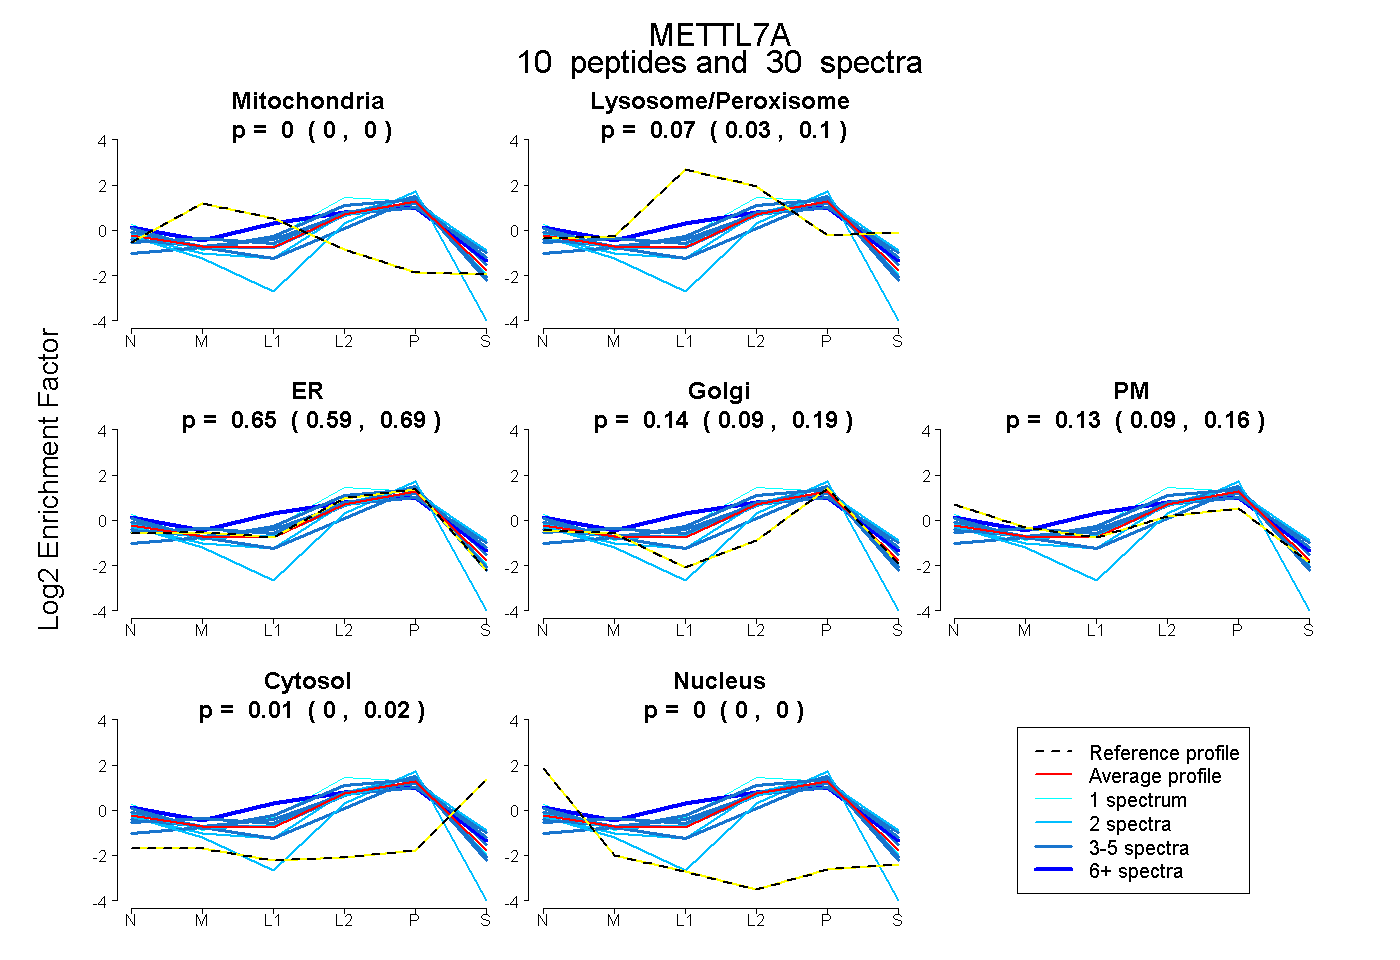
0.000 | 0.000
0.032 | 0.099
0.590 | 0.694
0.088 | 0.191
0.092 | 0.163
0.000 | 0.024
0.000 | 0.000
11peptides
spectra
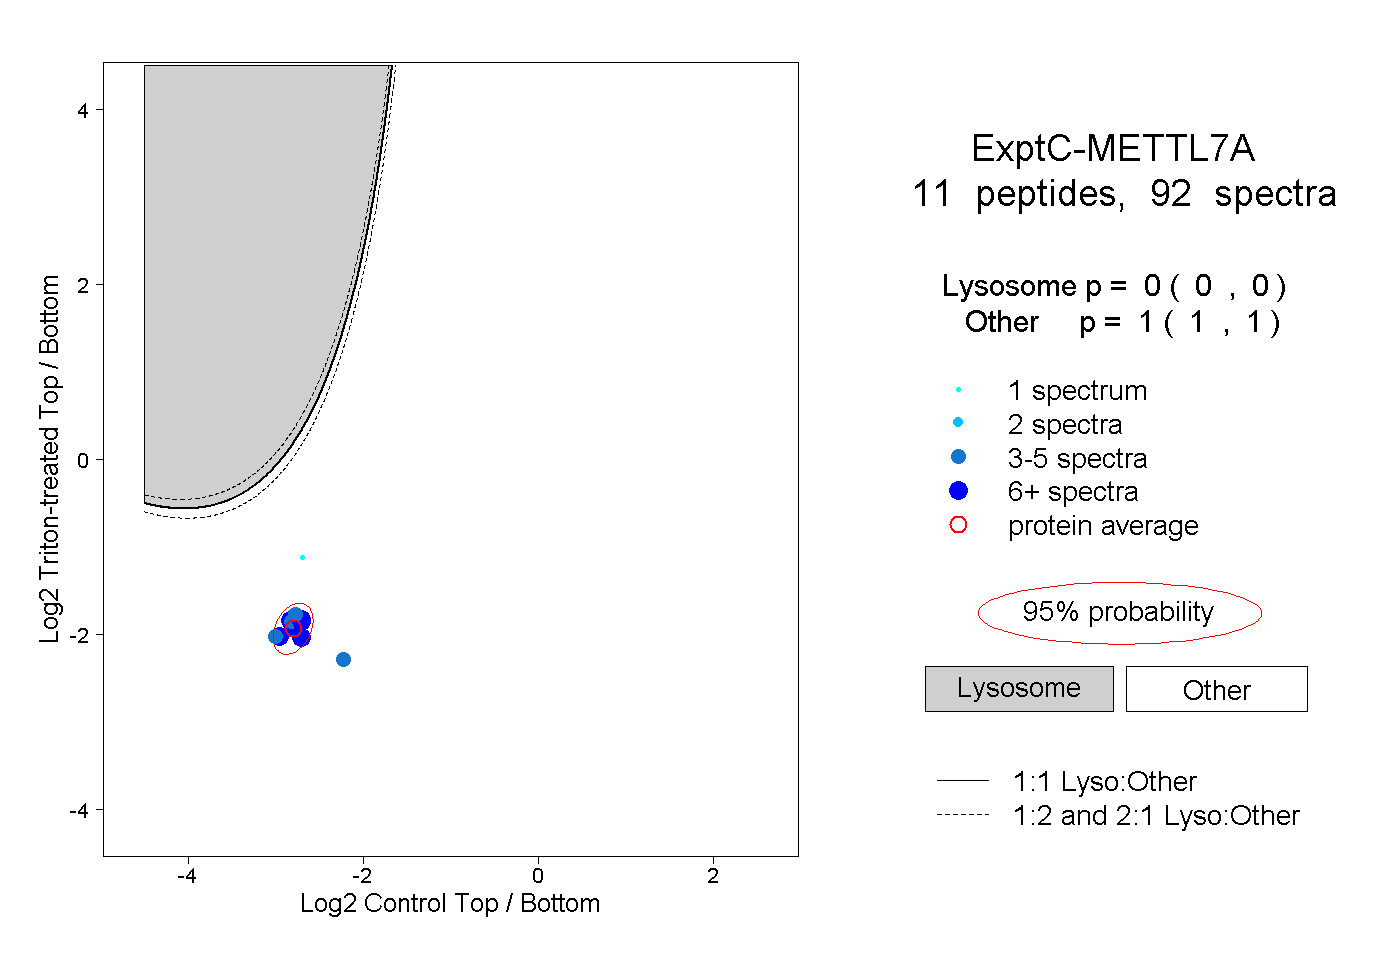
0.000 | 0.000
1.000 | 1.000
3peptides
spectra
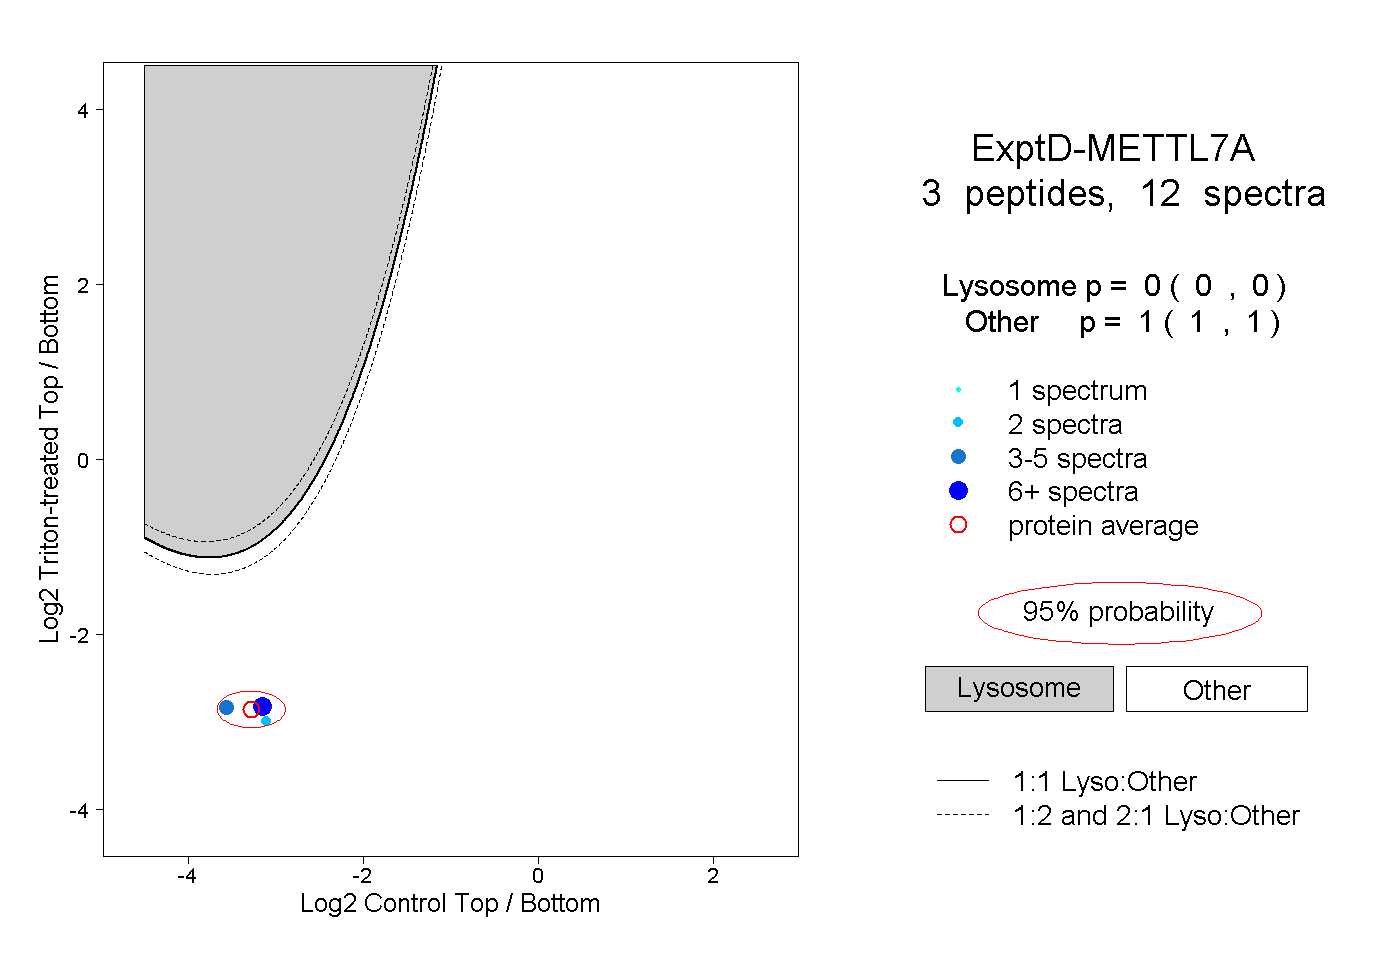
0.000 | 0.000
1.000 | 1.000