4
4peptides
spectra
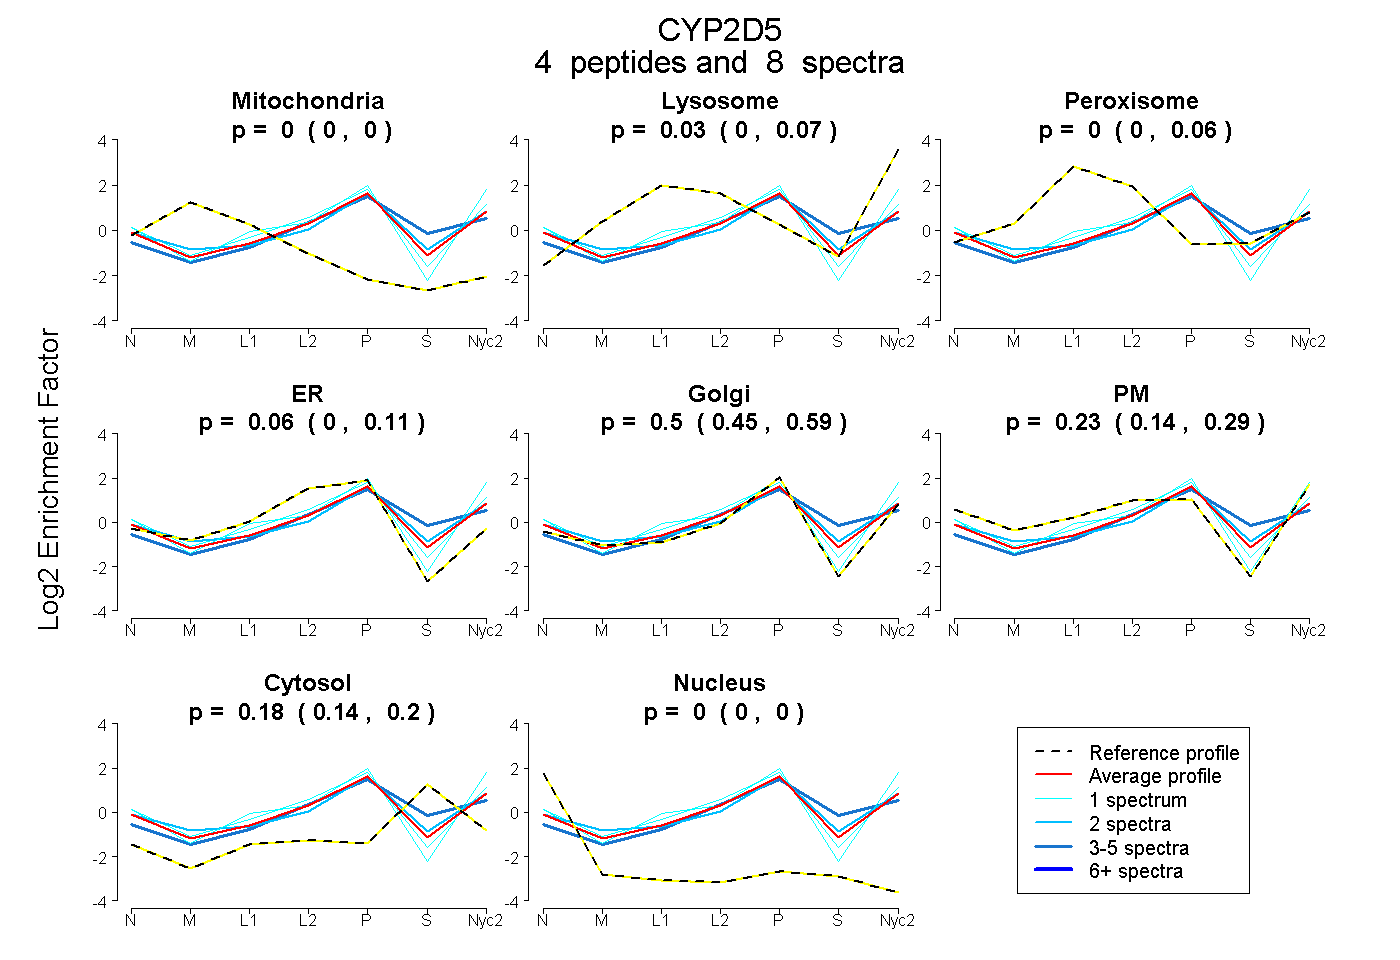
0.000 | 0.000
0.000 | 0.068
0.000 | 0.060
0.000 | 0.111
0.451 | 0.586
0.136 | 0.289
0.138 | 0.203
0.000 | 0.000
3peptides
spectra
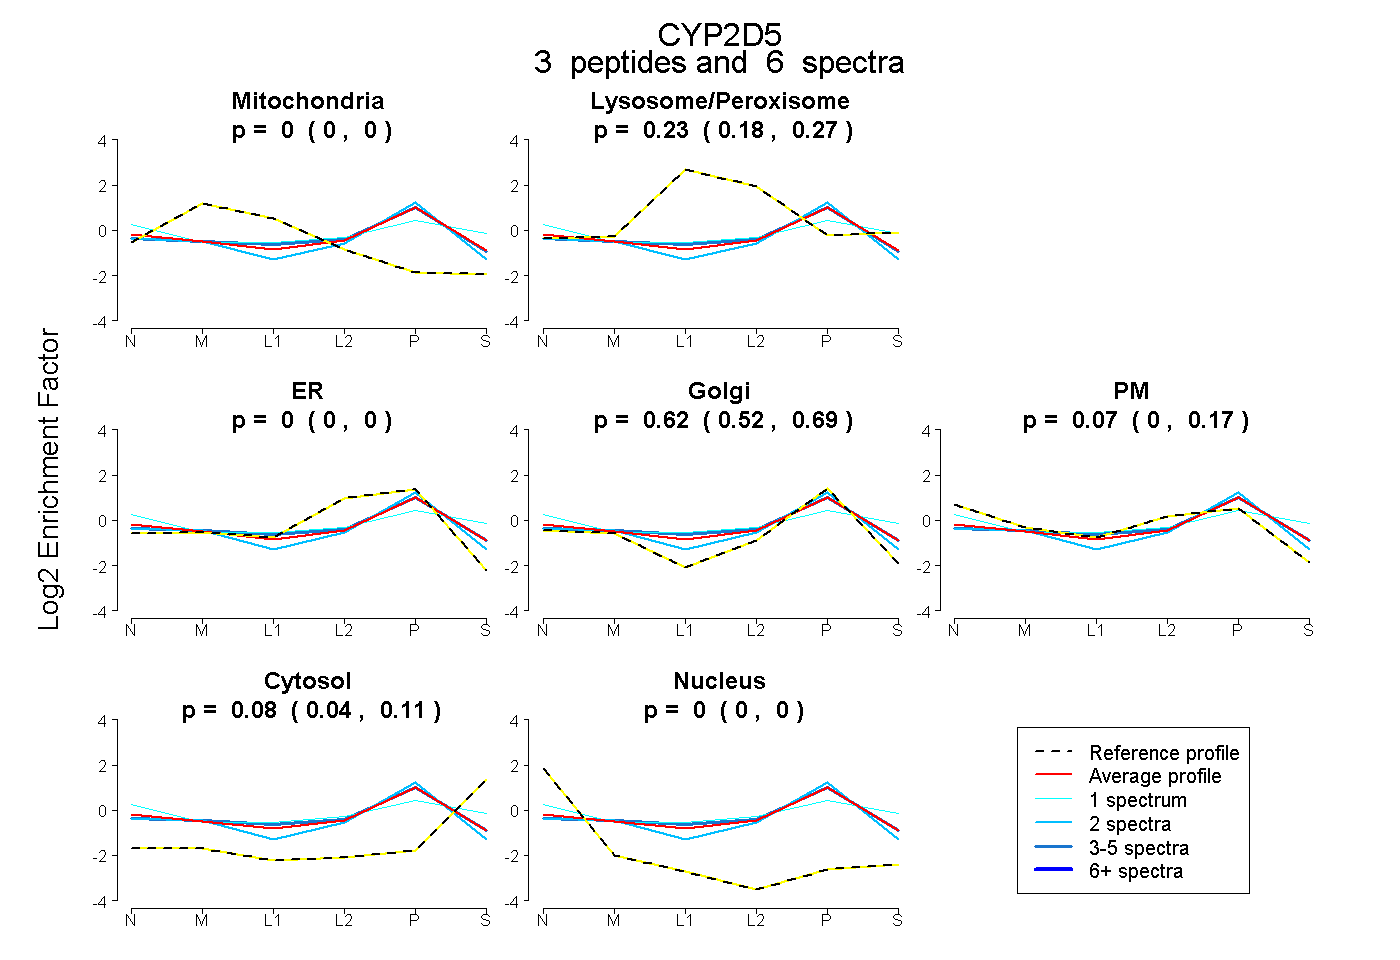
0.000 | 0.000
0.183 | 0.270
0.000 | 0.000
0.520 | 0.694
0.000 | 0.173
0.035 | 0.111
0.000 | 0.001