 4
4peptides
spectra
0.000 | 0.000
0.000 | 0.068
0.000 | 0.060
0.000 | 0.111
0.451 | 0.586
0.136 | 0.289
0.138 | 0.203
0.000 | 0.000
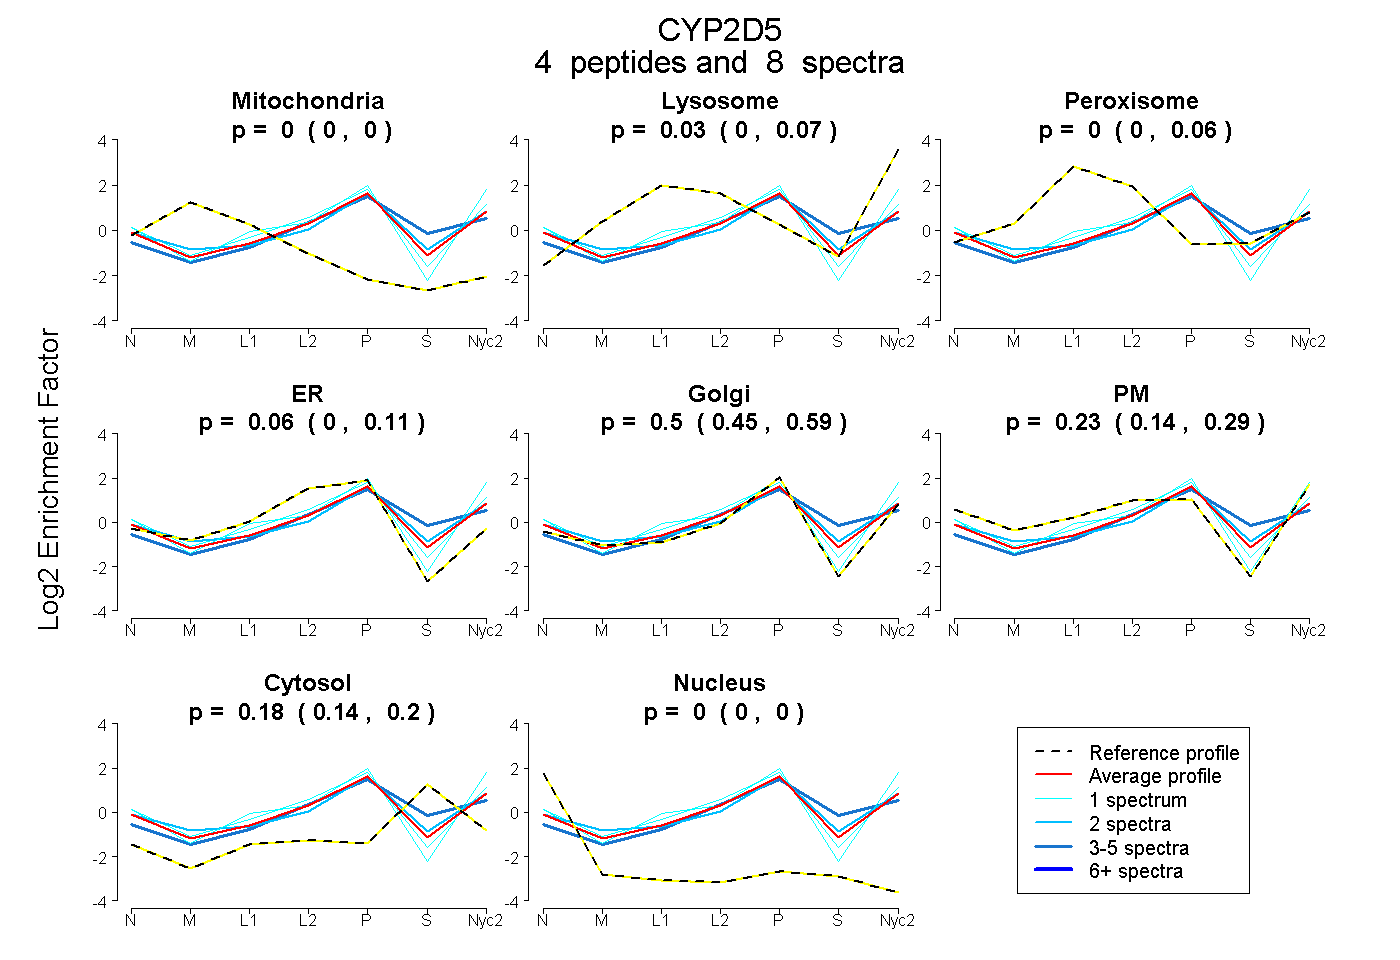
| Plot | Mito | Lyso | Perox | ER | Golgi | PM | Cytosol | Nucleus | |||||
| Expt A |
4 peptides |
8 spectra |
|
0.000 0.000 | 0.000 |
0.032 0.000 | 0.068 |
0.002 0.000 | 0.060 |
0.057 0.000 | 0.111 |
0.501 0.451 | 0.586 |
0.229 0.136 | 0.289 |
0.179 0.138 | 0.203 |
0.000 0.000 | 0.000 |
| 1 spectrum, SQGVVFASYGPEWR | 0.000 | 0.022 | 0.000 | 0.072 | 0.445 | 0.381 | 0.080 | 0.000 | ||
| 2 spectra, TFMAFLDNLLAENR | 0.000 | 0.037 | 0.037 | 0.000 | 0.575 | 0.165 | 0.185 | 0.000 | ||
| 4 spectra, EAGHLCDAFTAQNGR | 0.000 | 0.105 | 0.000 | 0.160 | 0.404 | 0.000 | 0.331 | 0.000 | ||
| 1 spectrum, YGDVFSLQMGWKPMVIVNR | 0.000 | 0.071 | 0.000 | 0.000 | 0.571 | 0.358 | 0.000 | 0.000 |
| Plot | Mito | Lyso or Perox | ER | Golgi | PM | Cytosol | Nucleus | ||||||
| Expt B |
3 peptides |
6 spectra |
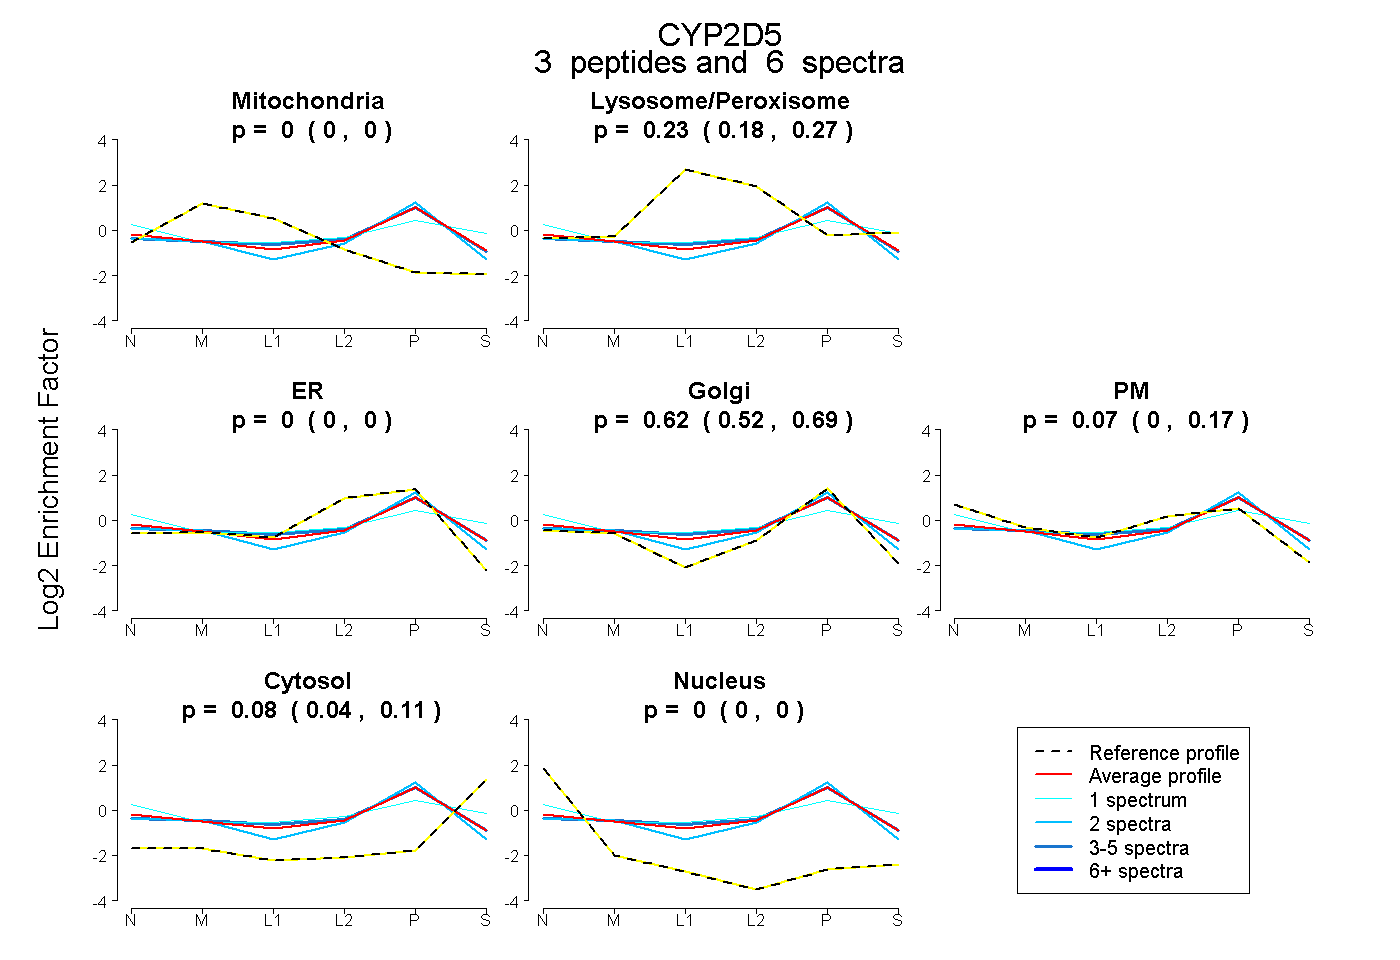 |
0.000 0.000 | 0.000 |
0.232 0.183 | 0.270 |
0.000 0.000 | 0.000 |
0.622 0.520 | 0.694 |
0.068 0.000 | 0.173 |
0.078 0.035 | 0.111 |
0.000 0.000 | 0.001 |
|||
| Plot | Lyso | Other | |||||||||||
| Expt C |
5 peptides |
25 spectra |
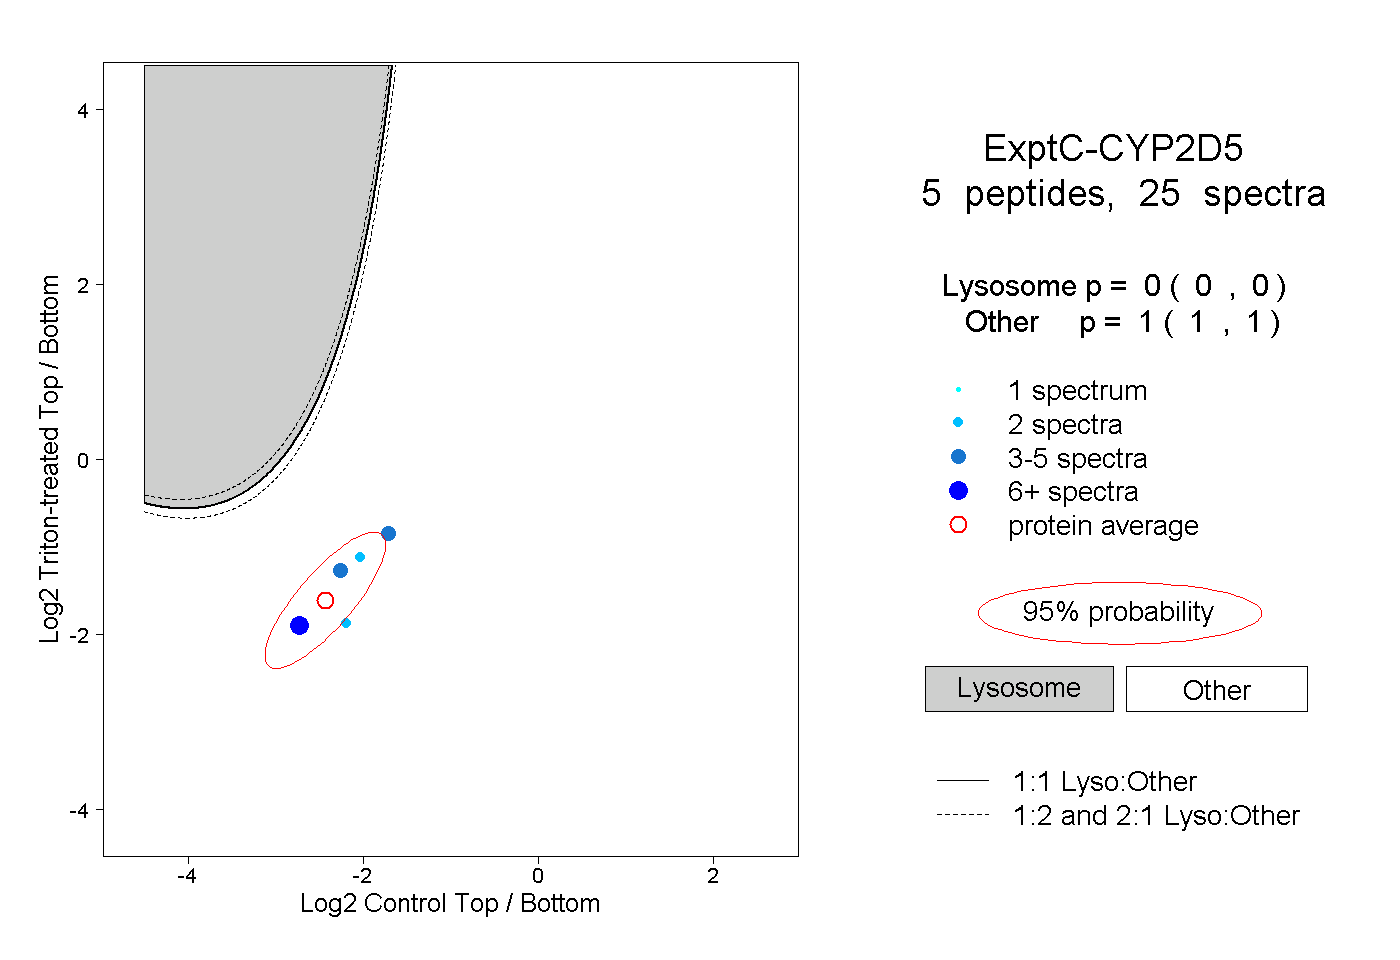 |
0.000 0.000 | 0.000 |
1.000 1.000 | 1.000 |