 5
5peptides
spectra
0.000 | 0.141
0.000 | 0.063
0.000 | 0.086
0.000 | 0.085
0.000 | 0.142
0.000 | 0.161
0.000 | 0.226
0.569 | 0.725
2peptides
spectra
NA | NA
NA | NA
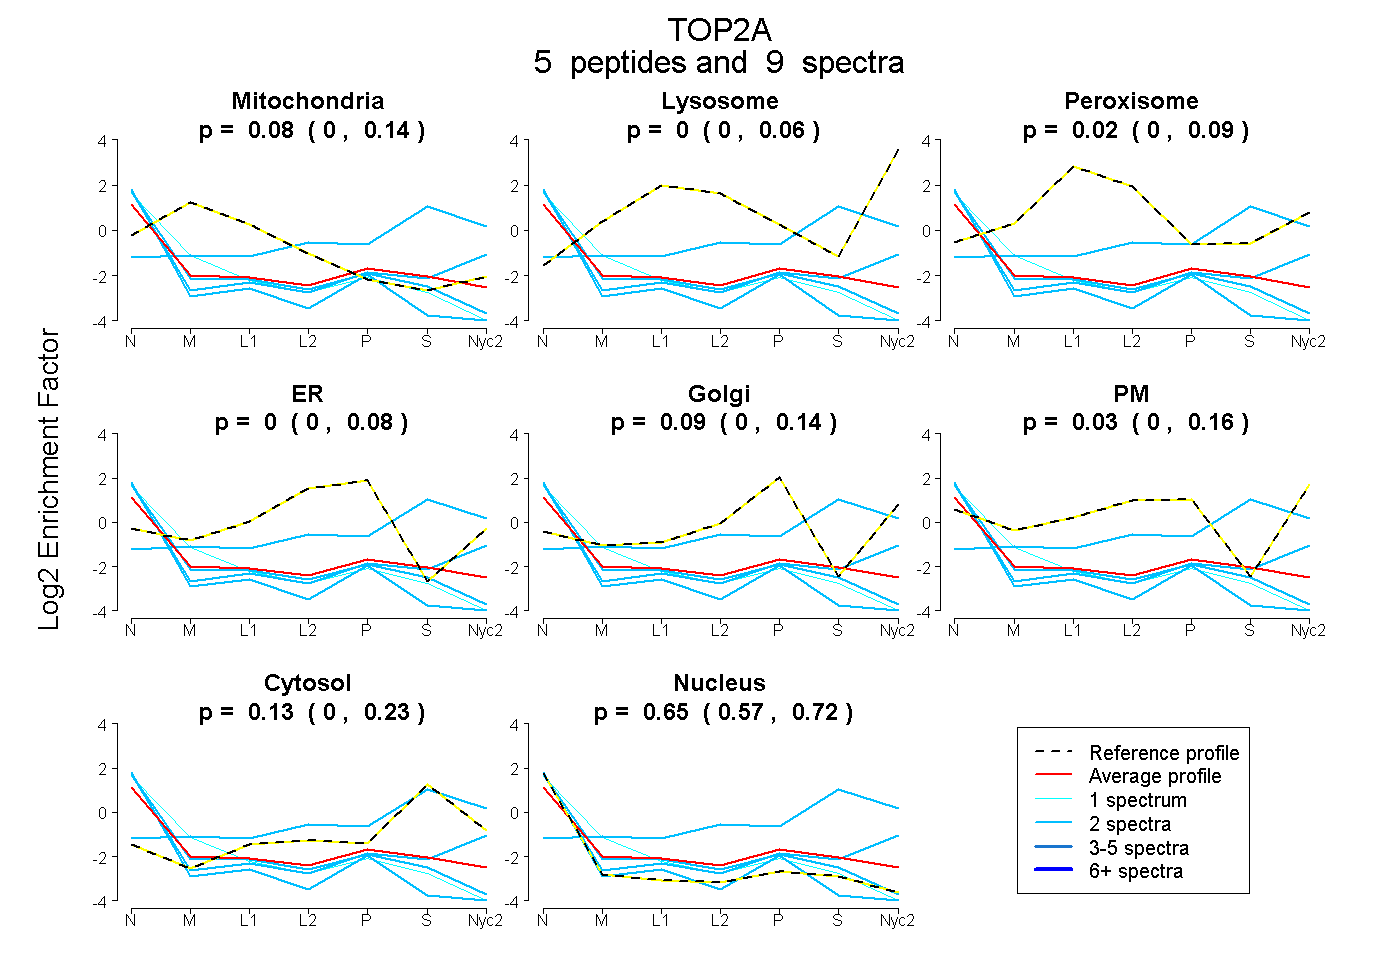
| Plot | Mito | Lyso | Perox | ER | Golgi | PM | Cytosol | Nucleus | |||||
| Expt A |
5 peptides |
9 spectra |
|
0.081 0.000 | 0.141 |
0.000 0.000 | 0.063 |
0.025 0.000 | 0.086 |
0.000 0.000 | 0.085 |
0.091 0.000 | 0.142 |
0.030 0.000 | 0.161 |
0.128 0.000 | 0.226 |
0.645 0.569 | 0.725 |
||
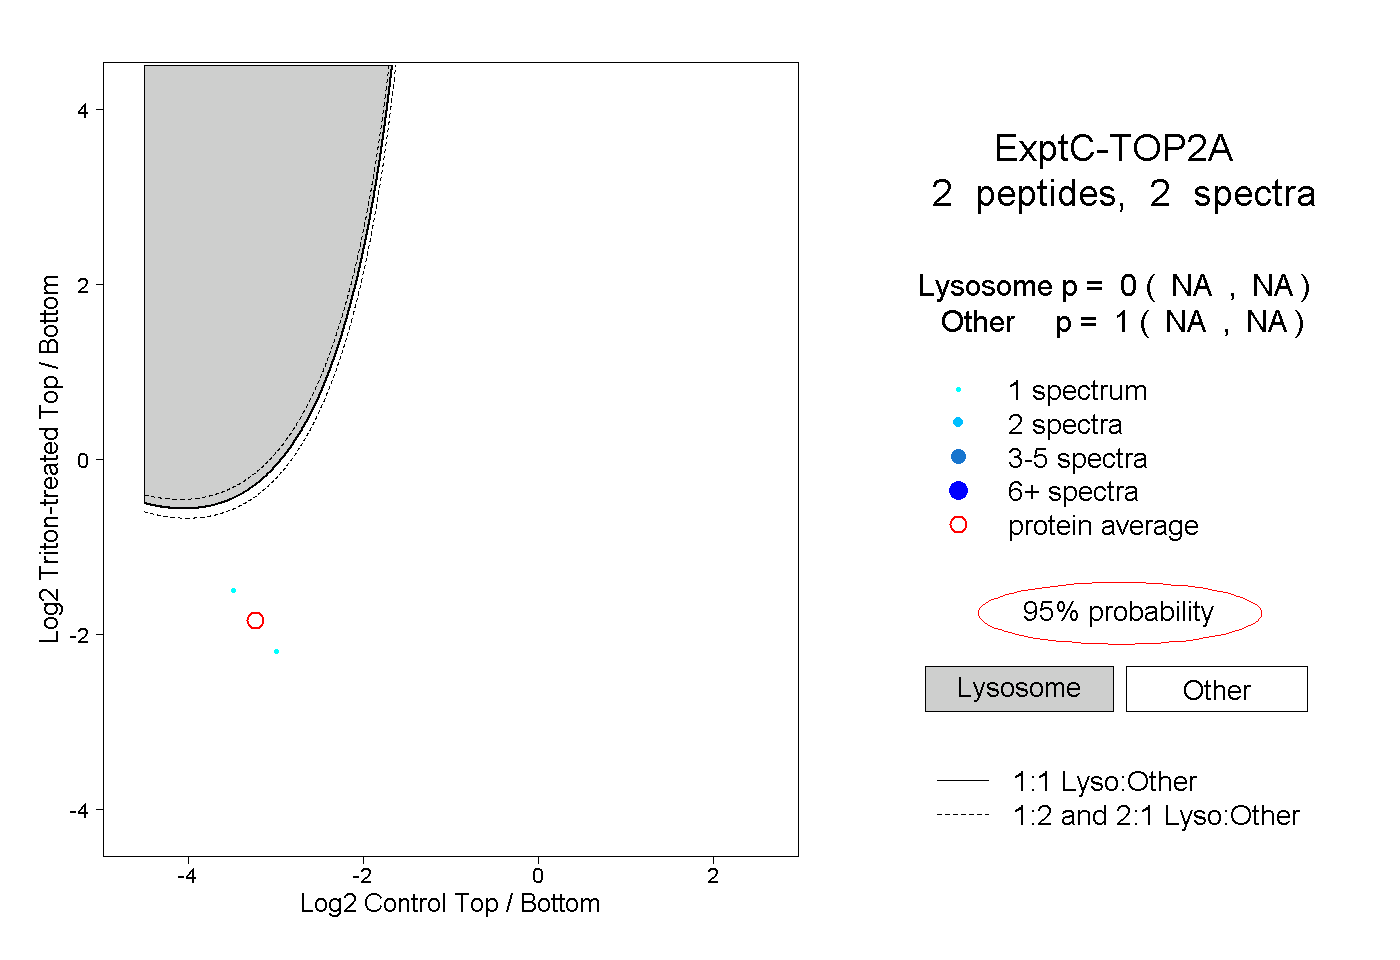
| Plot | Lyso | Other | |||||||||||
| Expt C |
2 peptides |
2 spectra |
|
0.000 NA | NA |
1.000 NA | NA |