 3
3peptides
spectra
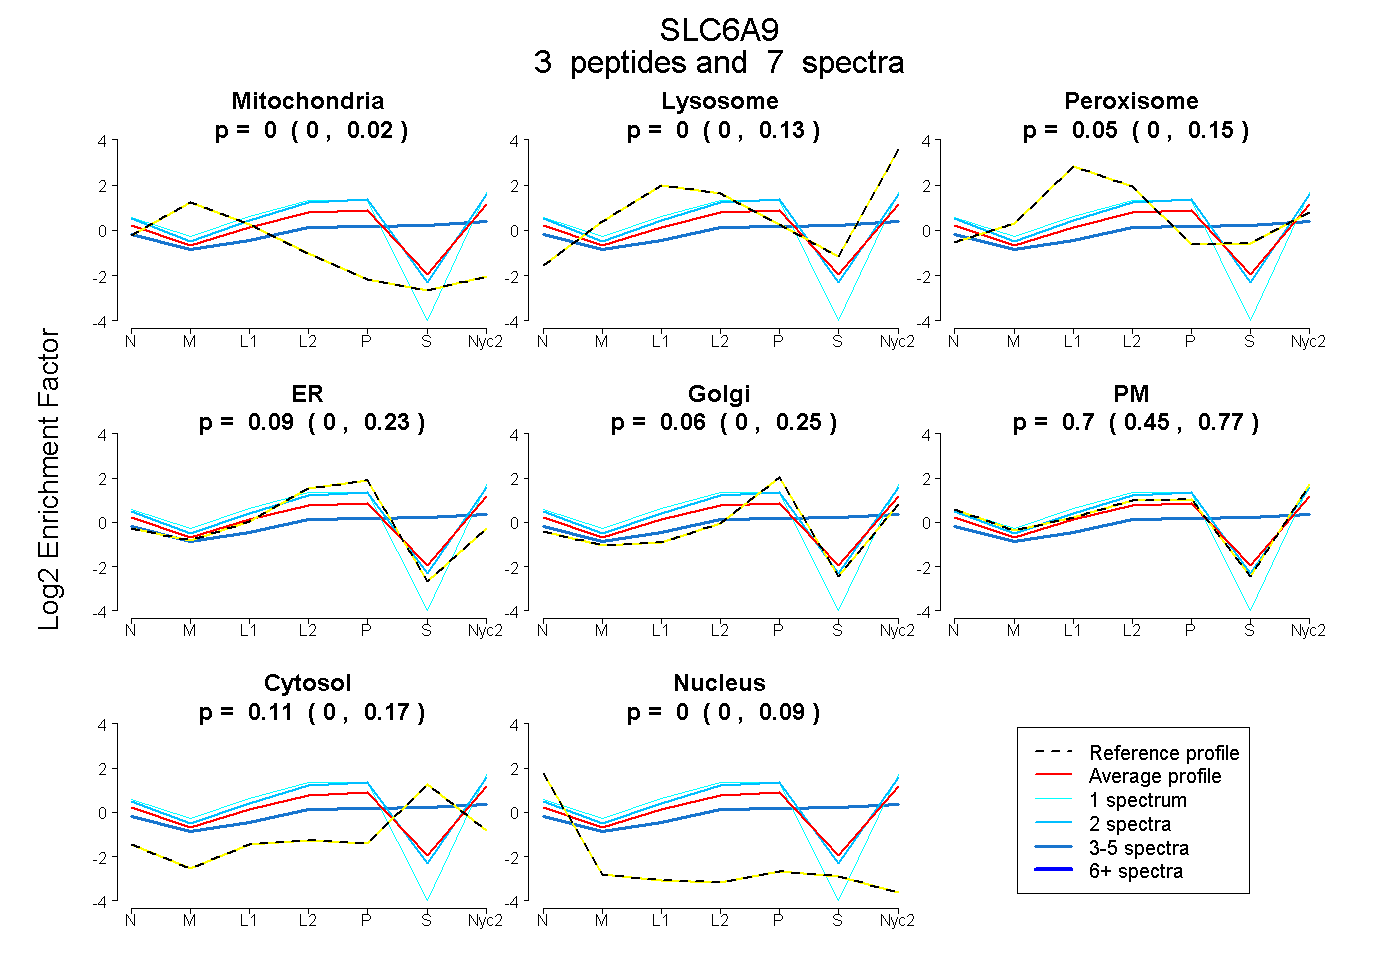
0.000 | 0.023
0.000 | 0.130
0.000 | 0.146
0.000 | 0.229
0.000 | 0.250
0.448 | 0.772
0.000 | 0.173
0.000 | 0.085
| Plot | Mito | Lyso | Perox | ER | Golgi | PM | Cytosol | Nucleus | |||||
| Expt A |
3 peptides |
7 spectra |
|
0.000 0.000 | 0.023 |
0.000 0.000 | 0.130 |
0.054 0.000 | 0.146 |
0.089 0.000 | 0.229 |
0.057 0.000 | 0.250 |
0.695 0.448 | 0.772 |
0.106 0.000 | 0.173 |
0.000 0.000 | 0.085 |
| 1 spectrum, LSDDIGDFGEVR | 0.000 | 0.000 | 0.000 | 0.109 | 0.000 | 0.891 | 0.000 | 0.000 | ||
| 2 spectra, TSPSEEYWR | 0.000 | 0.046 | 0.007 | 0.136 | 0.000 | 0.811 | 0.000 | 0.000 | ||
| 4 spectra, DWGPALLEHR | 0.000 | 0.000 | 0.130 | 0.000 | 0.023 | 0.381 | 0.467 | 0.000 |
| Plot | Lyso | Other | |||||||||||
| Expt C |
5 peptides |
16 spectra |
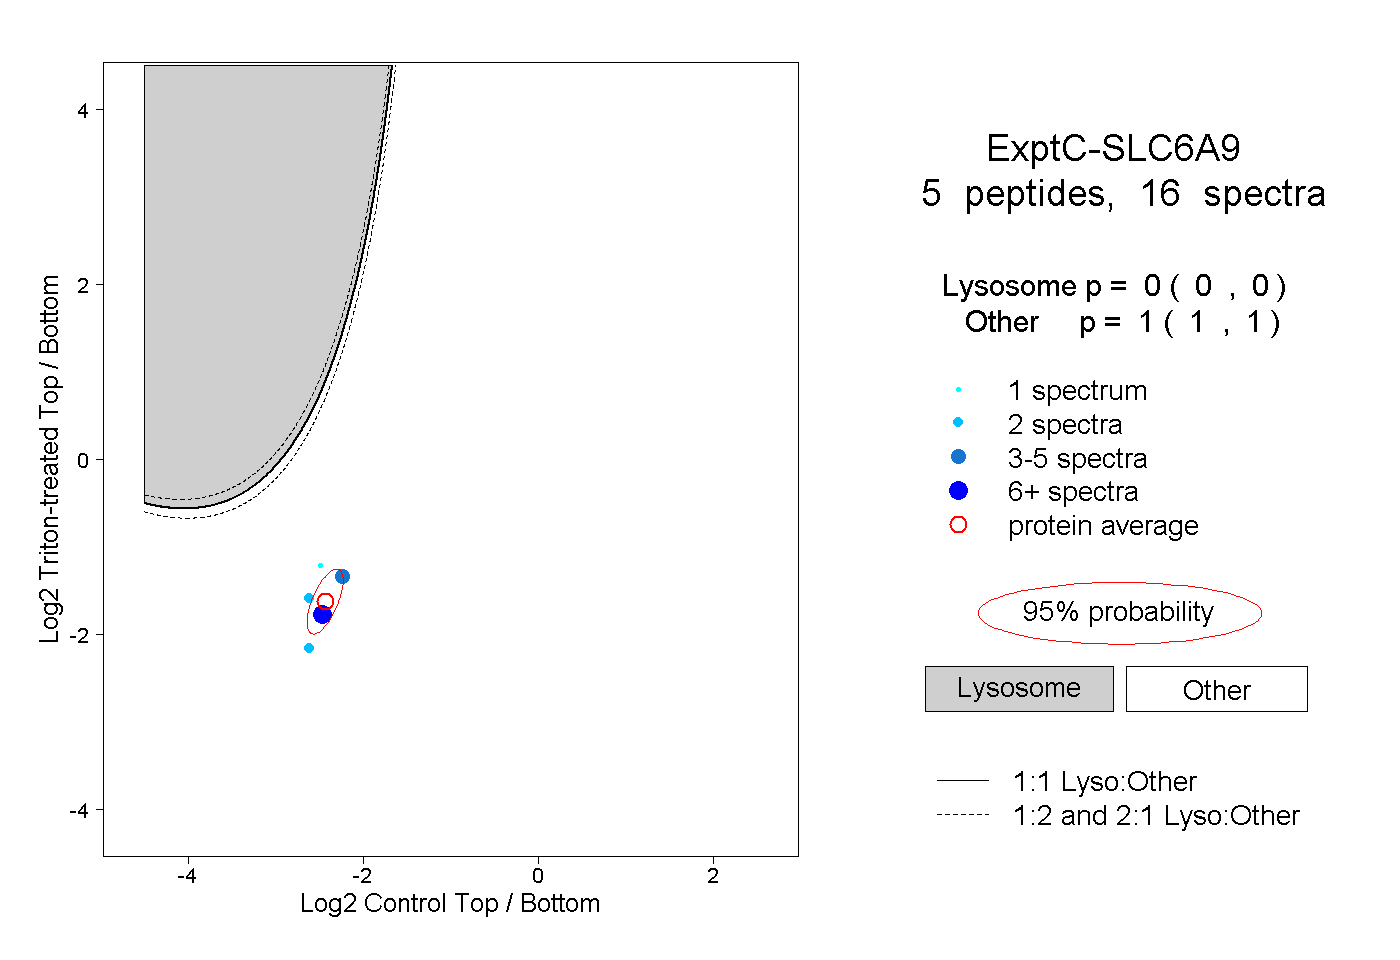 |
0.000 0.000 | 0.000 |
1.000 1.000 | 1.000 |