 18
18peptides
spectra
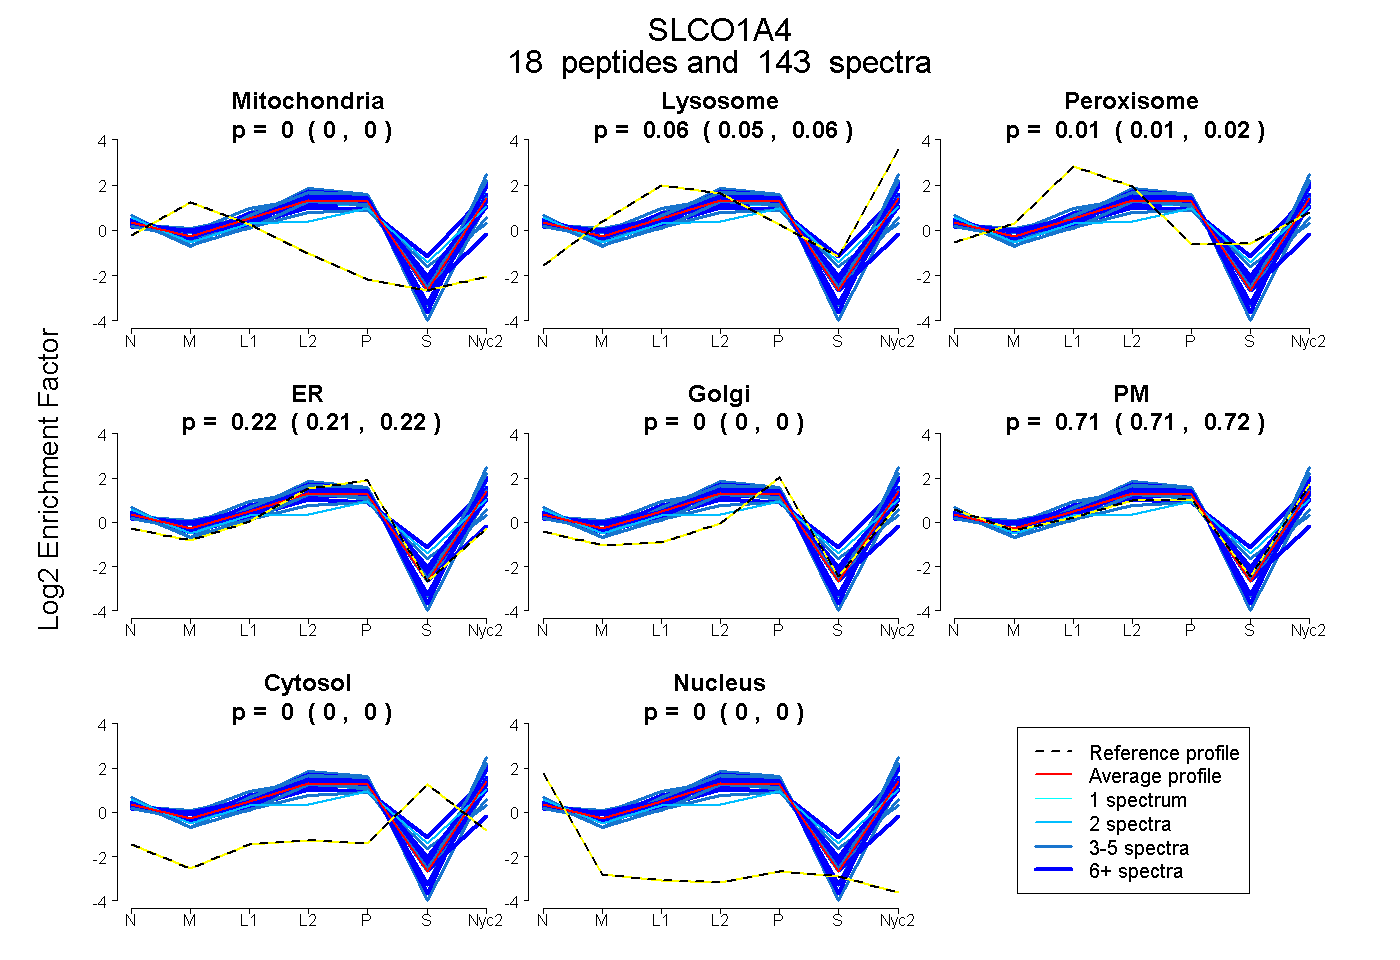
0.000 | 0.000
0.051 | 0.062
0.005 | 0.017
0.211 | 0.223
0.000 | 0.000
0.708 | 0.719
0.000 | 0.000
0.000 | 0.000
11peptides
spectra
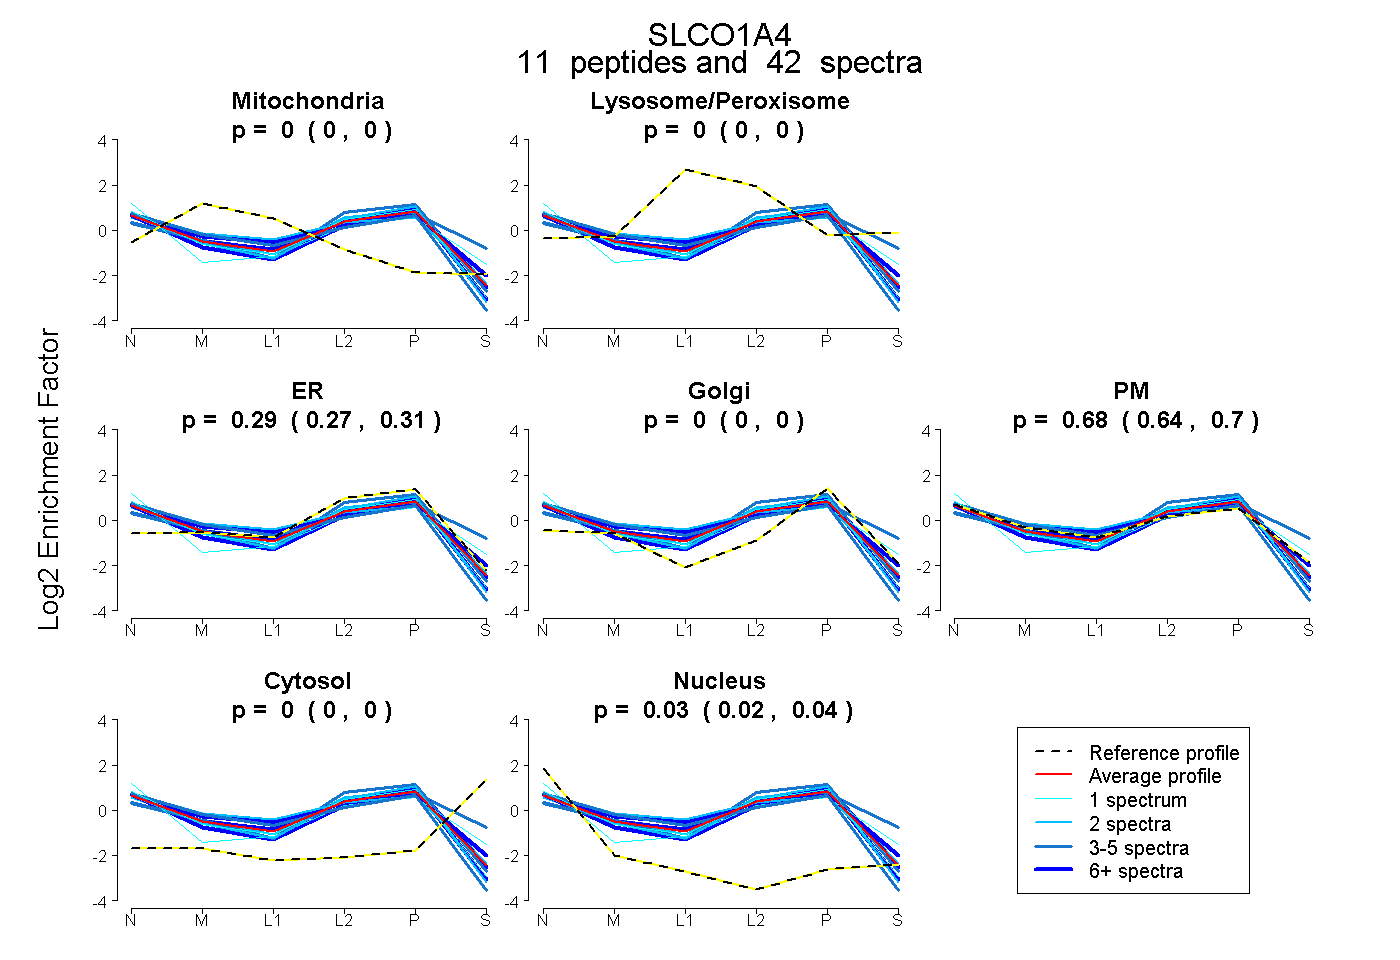
0.000 | 0.000
0.000 | 0.000
0.268 | 0.312
0.000 | 0.000
0.642 | 0.703
0.000 | 0.000
0.023 | 0.037
18peptides
spectra
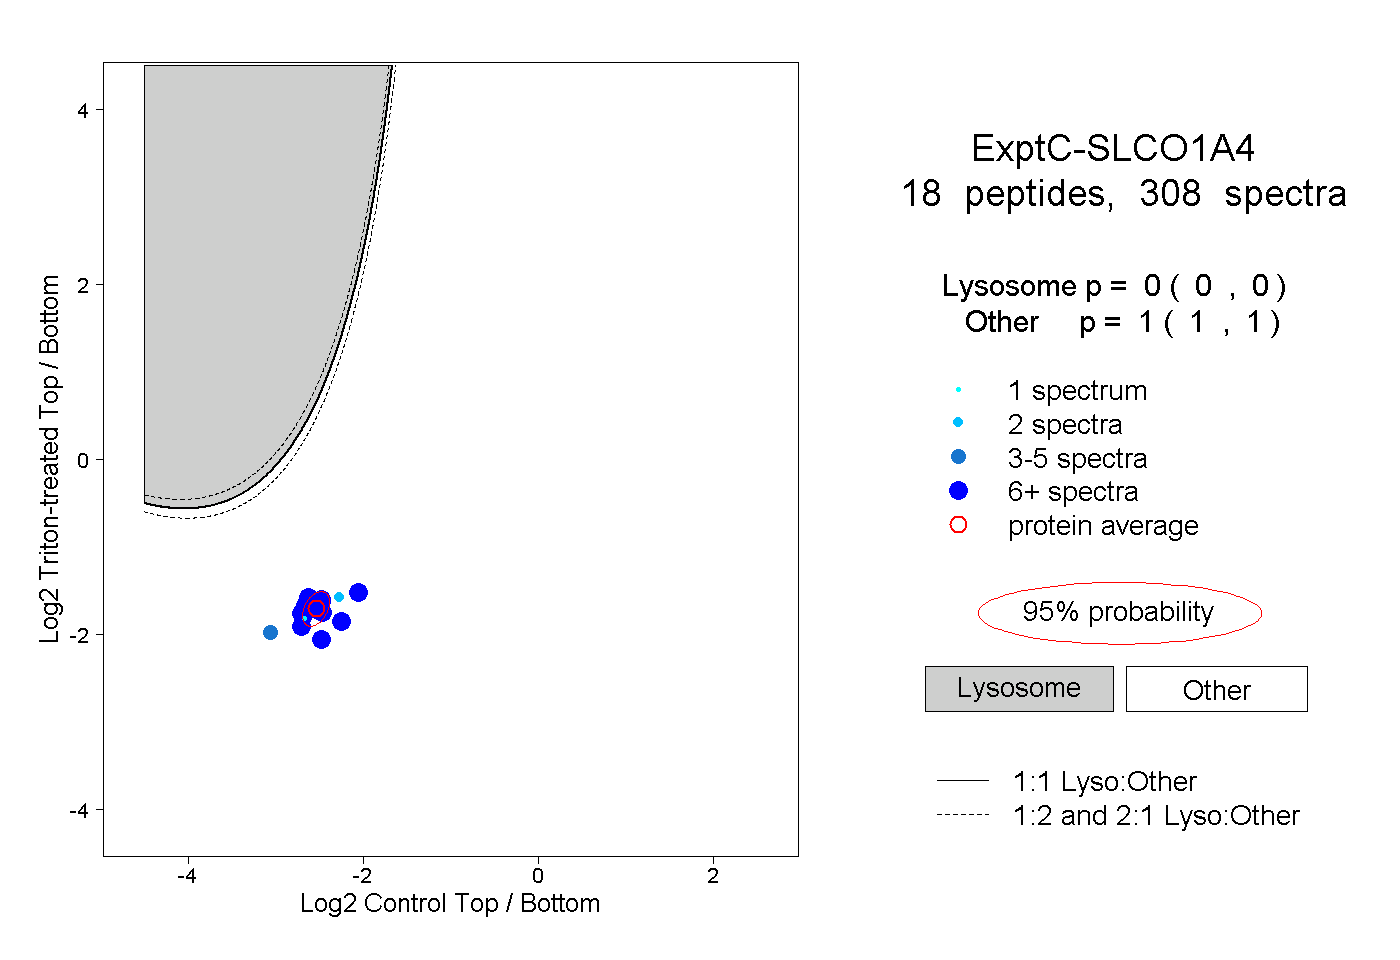
0.000 | 0.000
1.000 | 1.000
7peptides
spectra
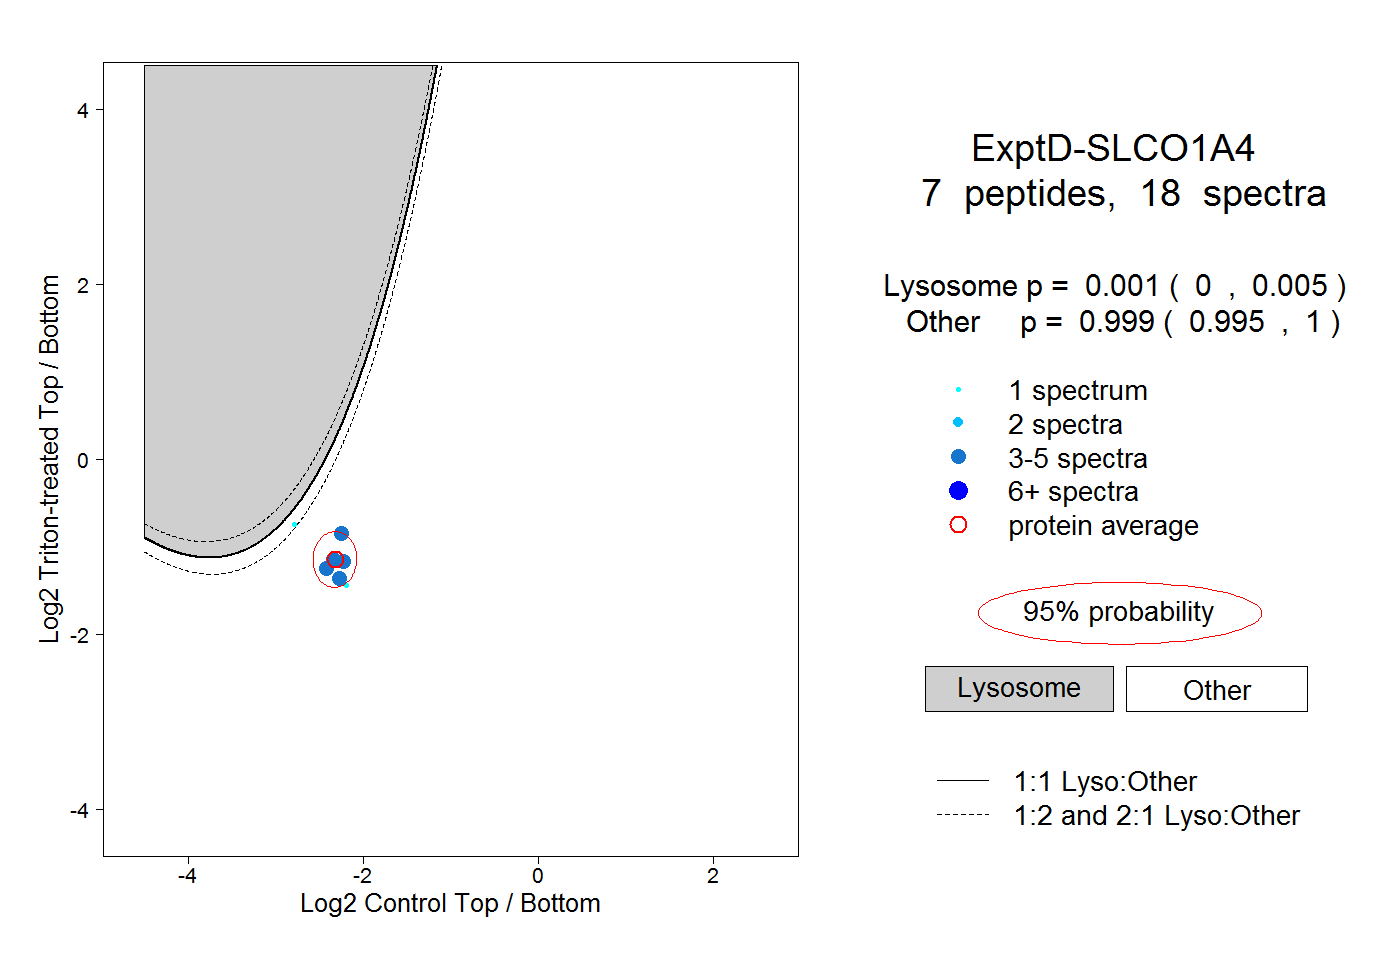
0.000 | 0.005
0.995 | 1.000