 13
13peptides
spectra
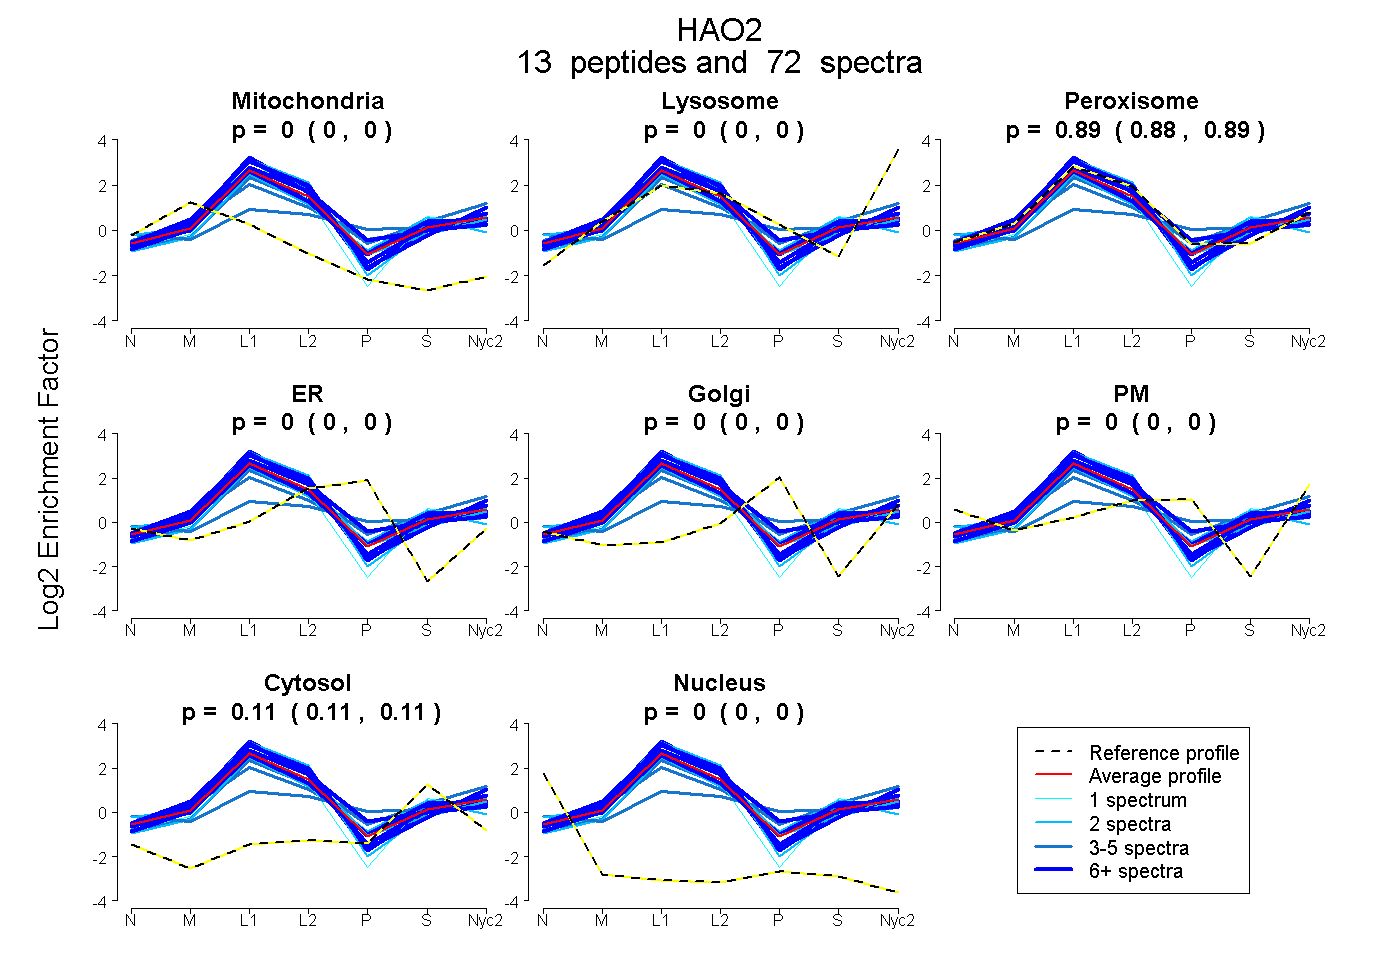
0.000 | 0.000
0.000 | 0.000
0.885 | 0.893
0.000 | 0.000
0.000 | 0.000
0.000 | 0.000
0.106 | 0.115
0.000 | 0.000
15peptides
spectra
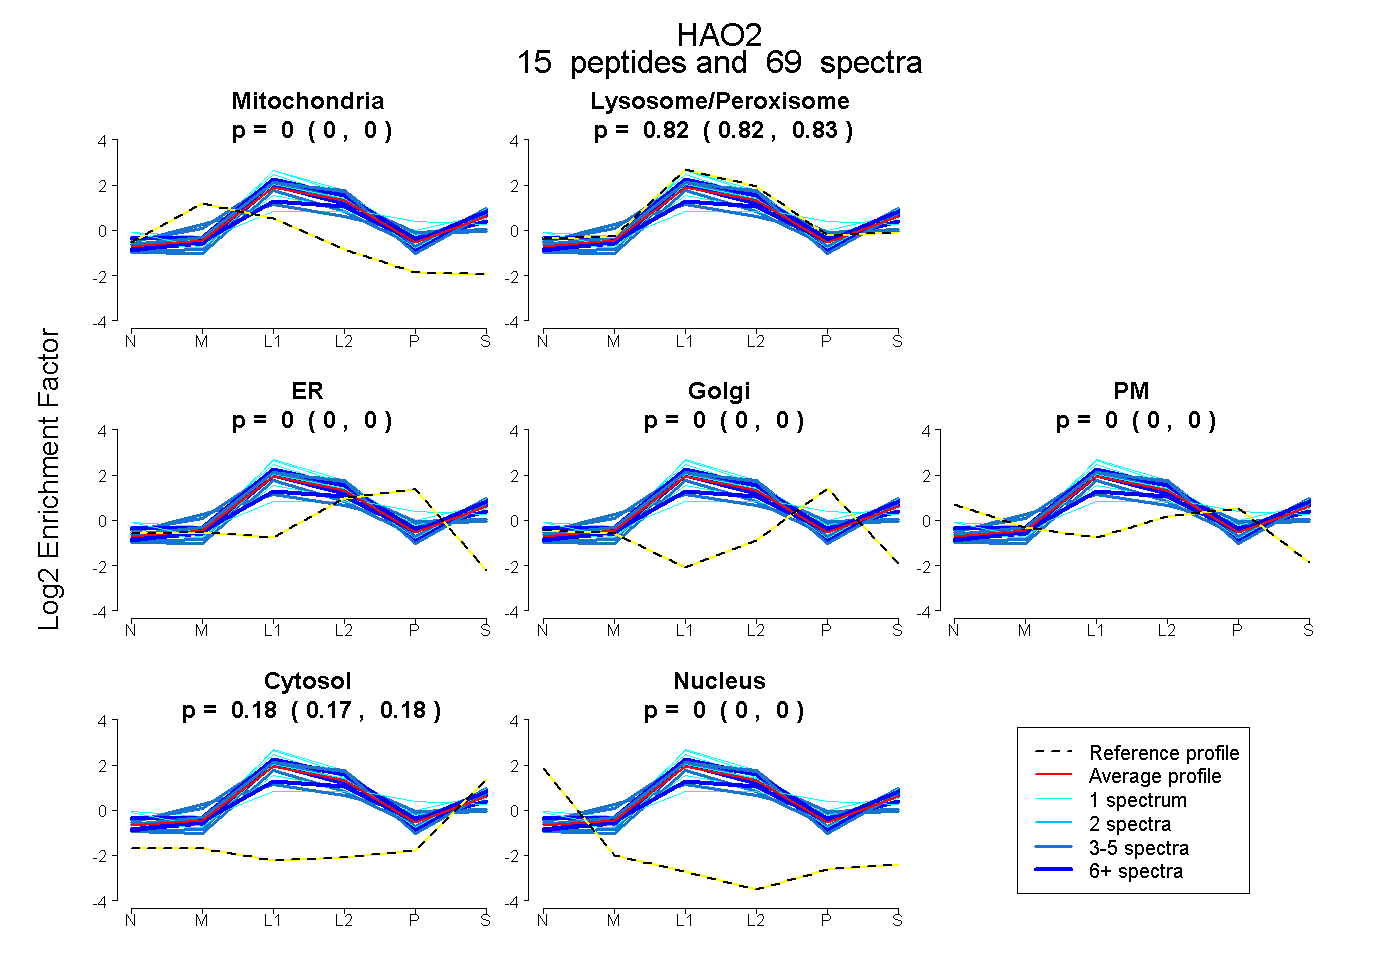
0.000 | 0.000
0.819 | 0.825
0.000 | 0.000
0.000 | 0.000
0.000 | 0.000
0.174 | 0.181
0.000 | 0.000
18peptides
spectra
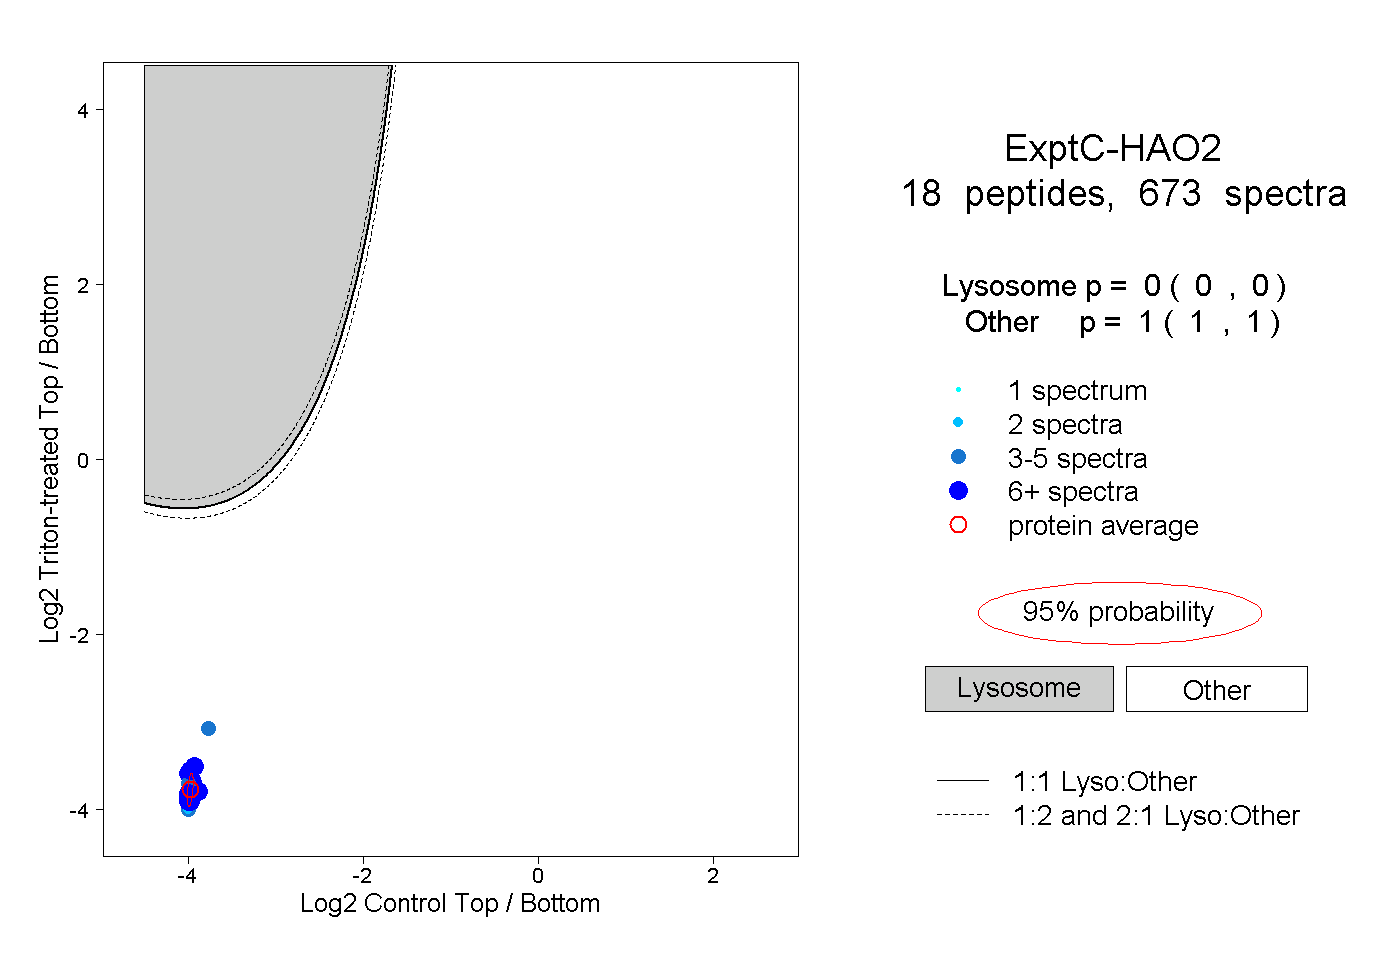
0.000 | 0.000
1.000 | 1.000
12peptides
spectra
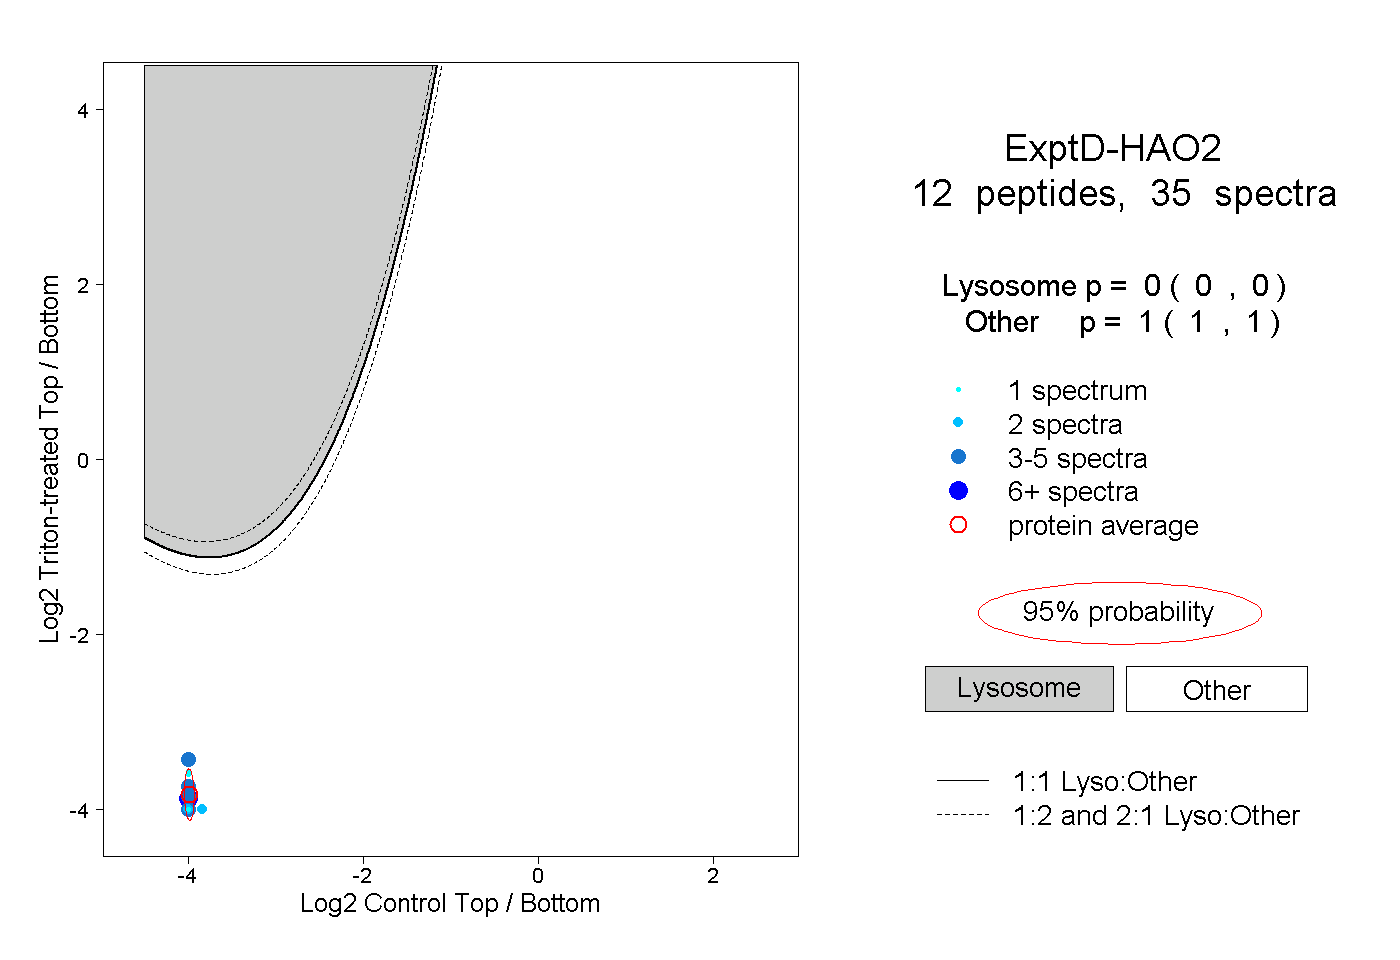
0.000 | 0.000
1.000 | 1.000