 13
13peptides
spectra
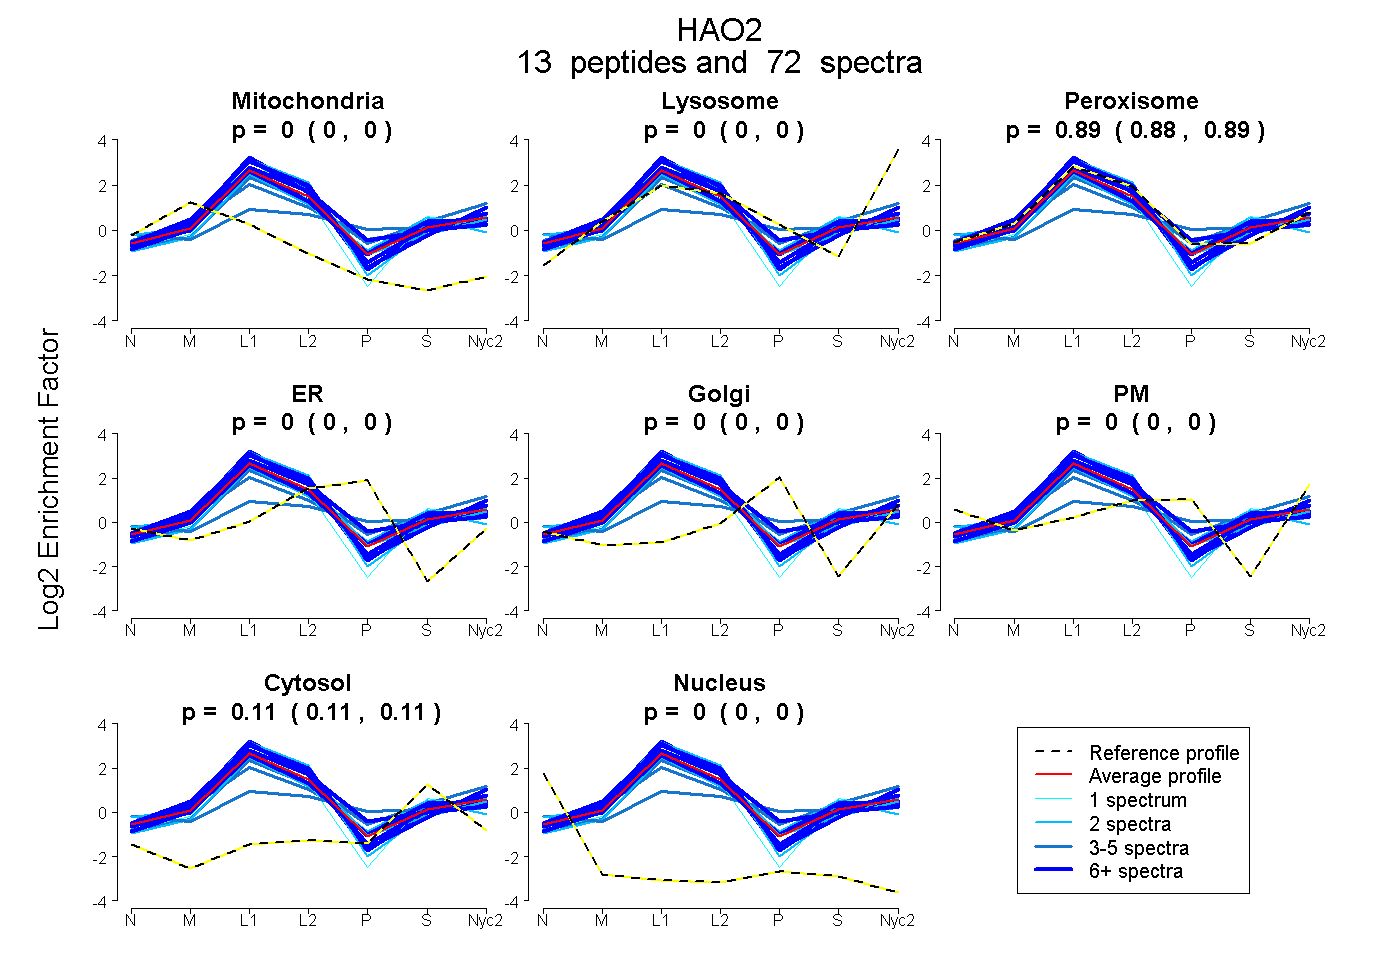
0.000 | 0.000
0.000 | 0.000
0.885 | 0.893
0.000 | 0.000
0.000 | 0.000
0.000 | 0.000
0.106 | 0.115
0.000 | 0.000
| Plot | Mito | Lyso | Perox | ER | Golgi | PM | Cytosol | Nucleus | |||||
| Expt A |
13 peptides |
72 spectra |
|
0.000 0.000 | 0.000 |
0.000 0.000 | 0.000 |
0.889 0.885 | 0.893 |
0.000 0.000 | 0.000 |
0.000 0.000 | 0.000 |
0.000 0.000 | 0.000 |
0.111 0.106 | 0.115 |
0.000 0.000 | 0.000 |
| 9 spectra, WFQLYMK | 0.000 | 0.000 | 1.000 | 0.000 | 0.000 | 0.000 | 0.000 | 0.000 | ||
| 6 spectra, IEVYMDGGVR | 0.000 | 0.000 | 0.848 | 0.000 | 0.000 | 0.000 | 0.152 | 0.000 | ||
| 2 spectra, EVVAAVK | 0.000 | 0.000 | 0.779 | 0.000 | 0.000 | 0.000 | 0.221 | 0.000 | ||
| 1 spectrum, GEDGVK | 0.000 | 0.000 | 0.841 | 0.000 | 0.000 | 0.000 | 0.159 | 0.000 | ||
| 4 spectra, EDAELAMK | 0.048 | 0.000 | 0.780 | 0.000 | 0.011 | 0.000 | 0.162 | 0.000 | ||
| 18 spectra, EVLDILTAELHR | 0.000 | 0.000 | 0.871 | 0.000 | 0.000 | 0.000 | 0.129 | 0.000 | ||
| 7 spectra, ALVITIDTPVLGNR | 0.012 | 0.000 | 0.962 | 0.000 | 0.000 | 0.000 | 0.026 | 0.000 | ||
| 2 spectra, LPILLK | 0.000 | 0.000 | 0.984 | 0.000 | 0.000 | 0.000 | 0.006 | 0.010 | ||
| 8 spectra, QLDEVSASIDALR | 0.000 | 0.000 | 0.962 | 0.000 | 0.000 | 0.000 | 0.038 | 0.000 | ||
| 3 spectra, AEALGFK | 0.000 | 0.140 | 0.691 | 0.000 | 0.000 | 0.000 | 0.169 | 0.000 | ||
| 2 spectra, NQLNLEANILLK | 0.008 | 0.000 | 0.992 | 0.000 | 0.000 | 0.000 | 0.000 | 0.000 | ||
| 4 spectra, HNVQGIVVSNHGGR | 0.000 | 0.040 | 0.442 | 0.000 | 0.000 | 0.235 | 0.283 | 0.000 | ||
| 6 spectra, SDWDFNK | 0.000 | 0.000 | 0.925 | 0.000 | 0.000 | 0.000 | 0.075 | 0.000 |
| Plot | Mito | Lyso or Perox | ER | Golgi | PM | Cytosol | Nucleus | ||||||
| Expt B |
15 peptides |
69 spectra |
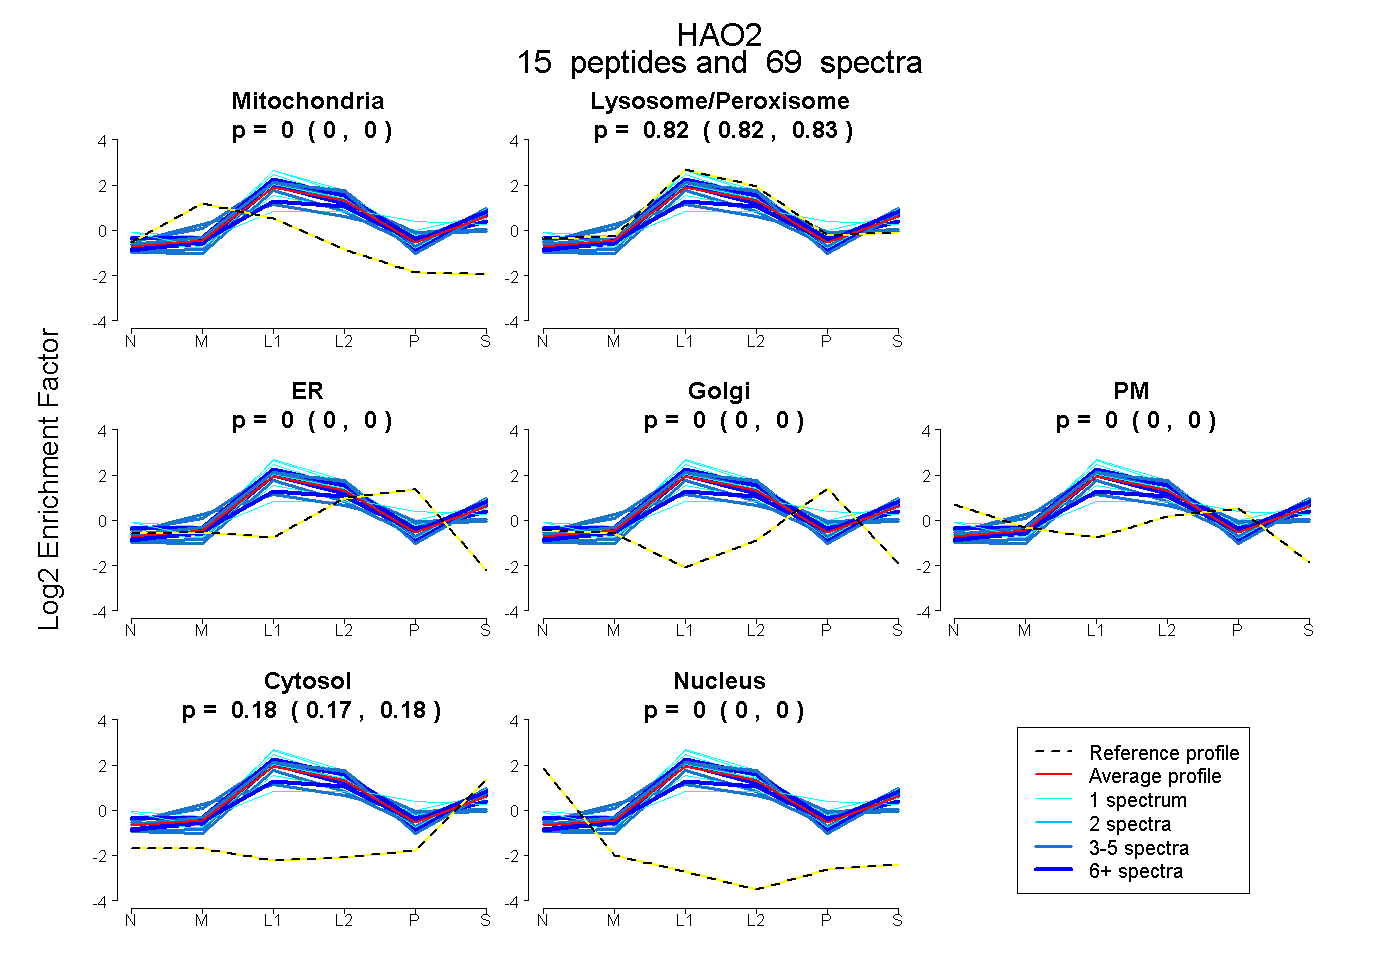 |
0.000 0.000 | 0.000 |
0.822 0.819 | 0.825 |
0.000 0.000 | 0.000 |
0.000 0.000 | 0.000 |
0.000 0.000 | 0.000 |
0.178 0.174 | 0.181 |
0.000 0.000 | 0.000 |
|||
| Plot | Lyso | Other | |||||||||||
| Expt C |
18 peptides |
673 spectra |
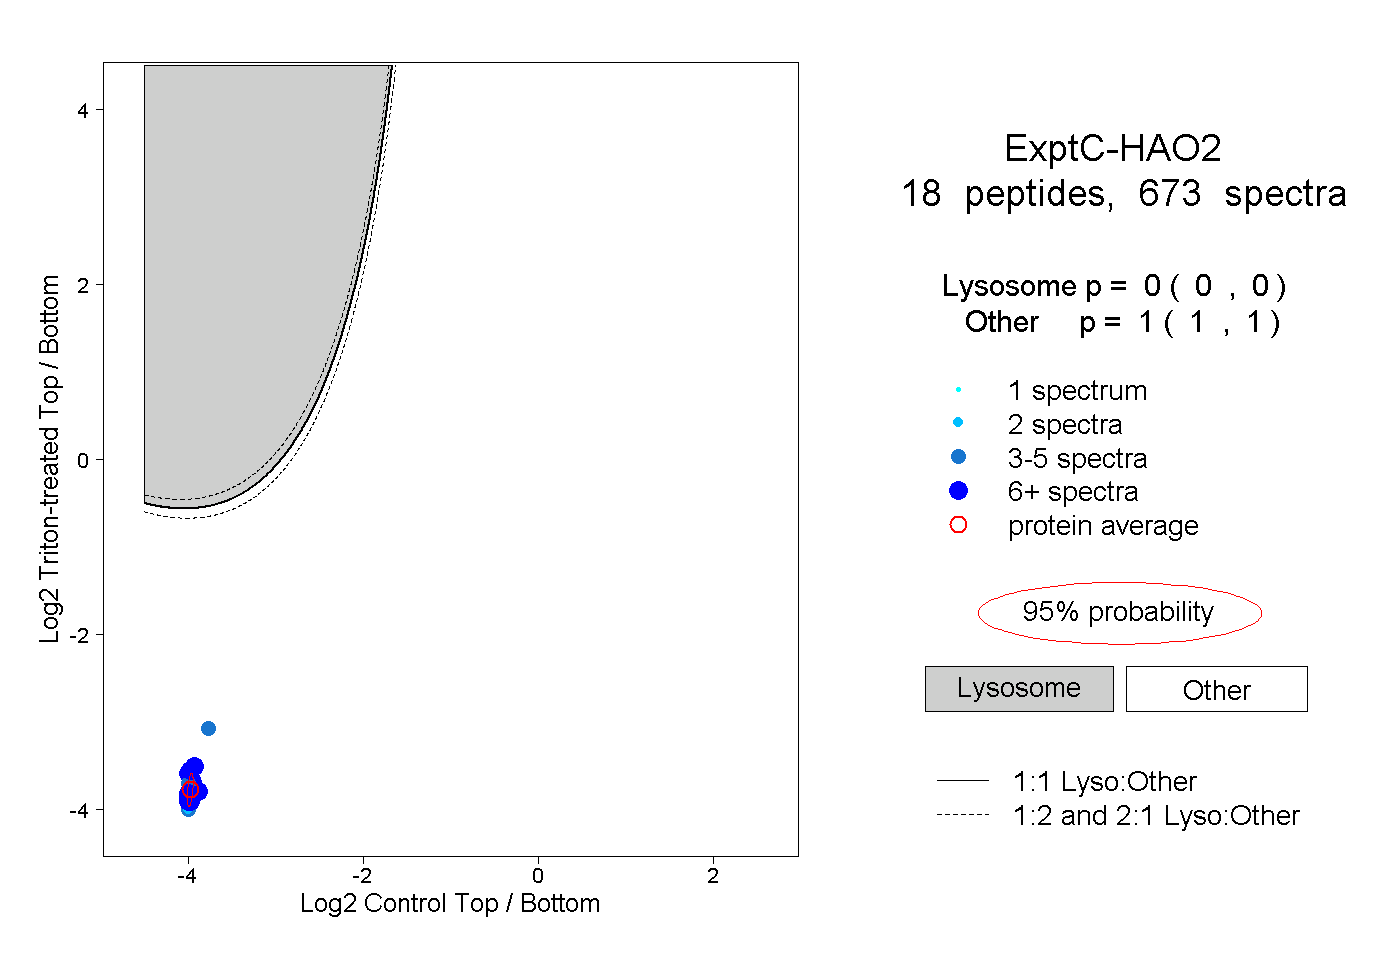 |
0.000 0.000 | 0.000 |
1.000 1.000 | 1.000 |
||||||||
| Plot | Lyso | Other | |||||||||||
| Expt D |
12 peptides |
35 spectra |
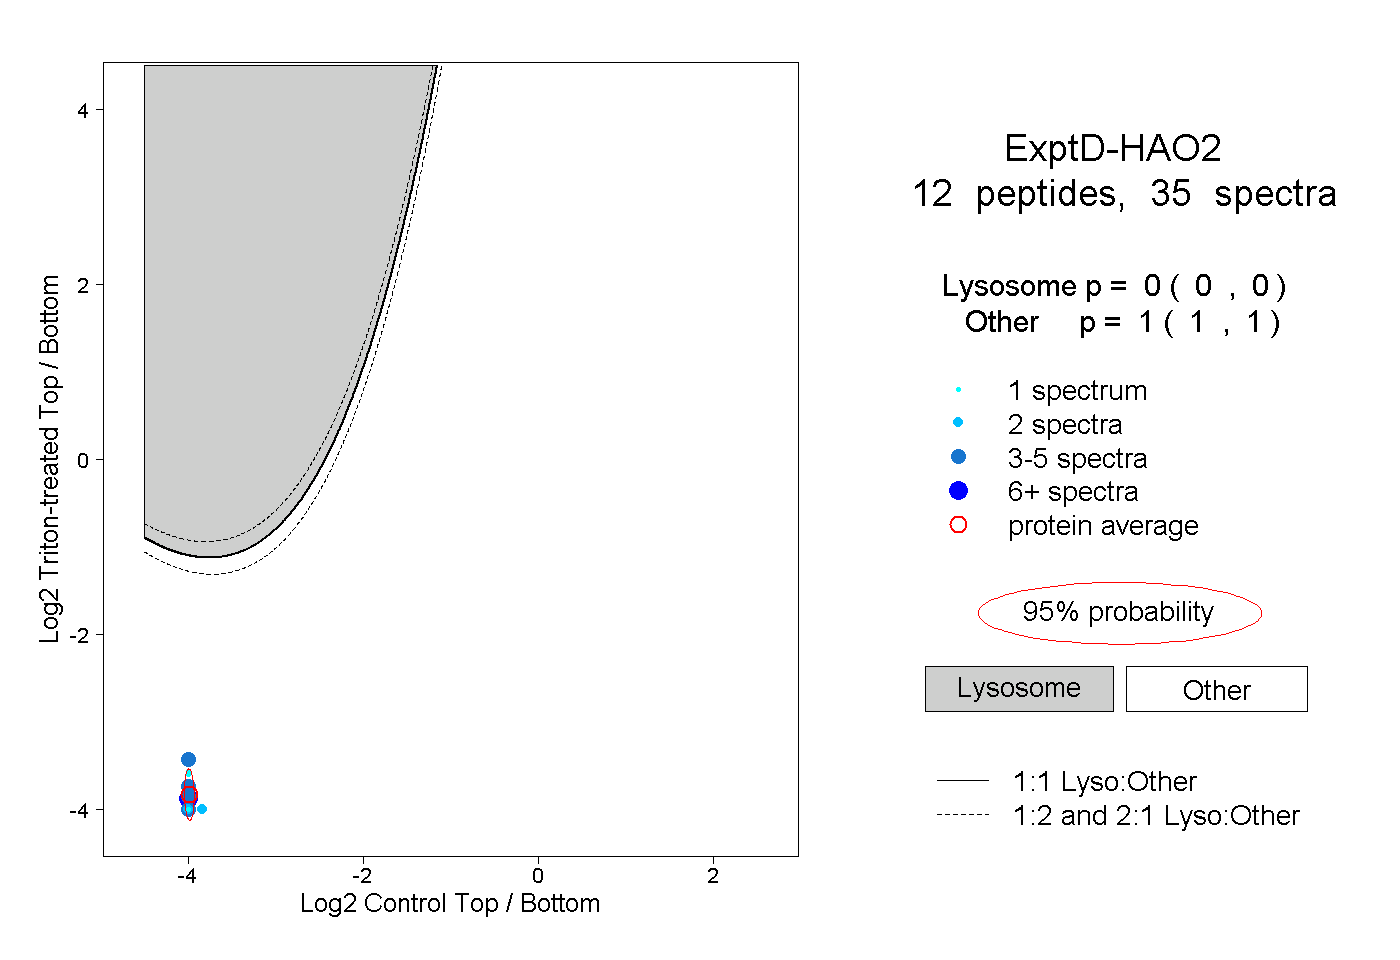 |
0.000 0.000 | 0.000 |
1.000 1.000 | 1.000 |