 4
4peptides
spectra
0.000 | 0.000
0.000 | 0.026
0.000 | 0.000
0.000 | 0.000
0.000 | 0.225
0.552 | 0.796
0.076 | 0.210
0.025 | 0.127
1peptide
spectra
0.000 | 0.000
1.000 | 1.000
| Plot | Mito | Lyso | Perox | ER | Golgi | PM | Cytosol | Nucleus | |||||
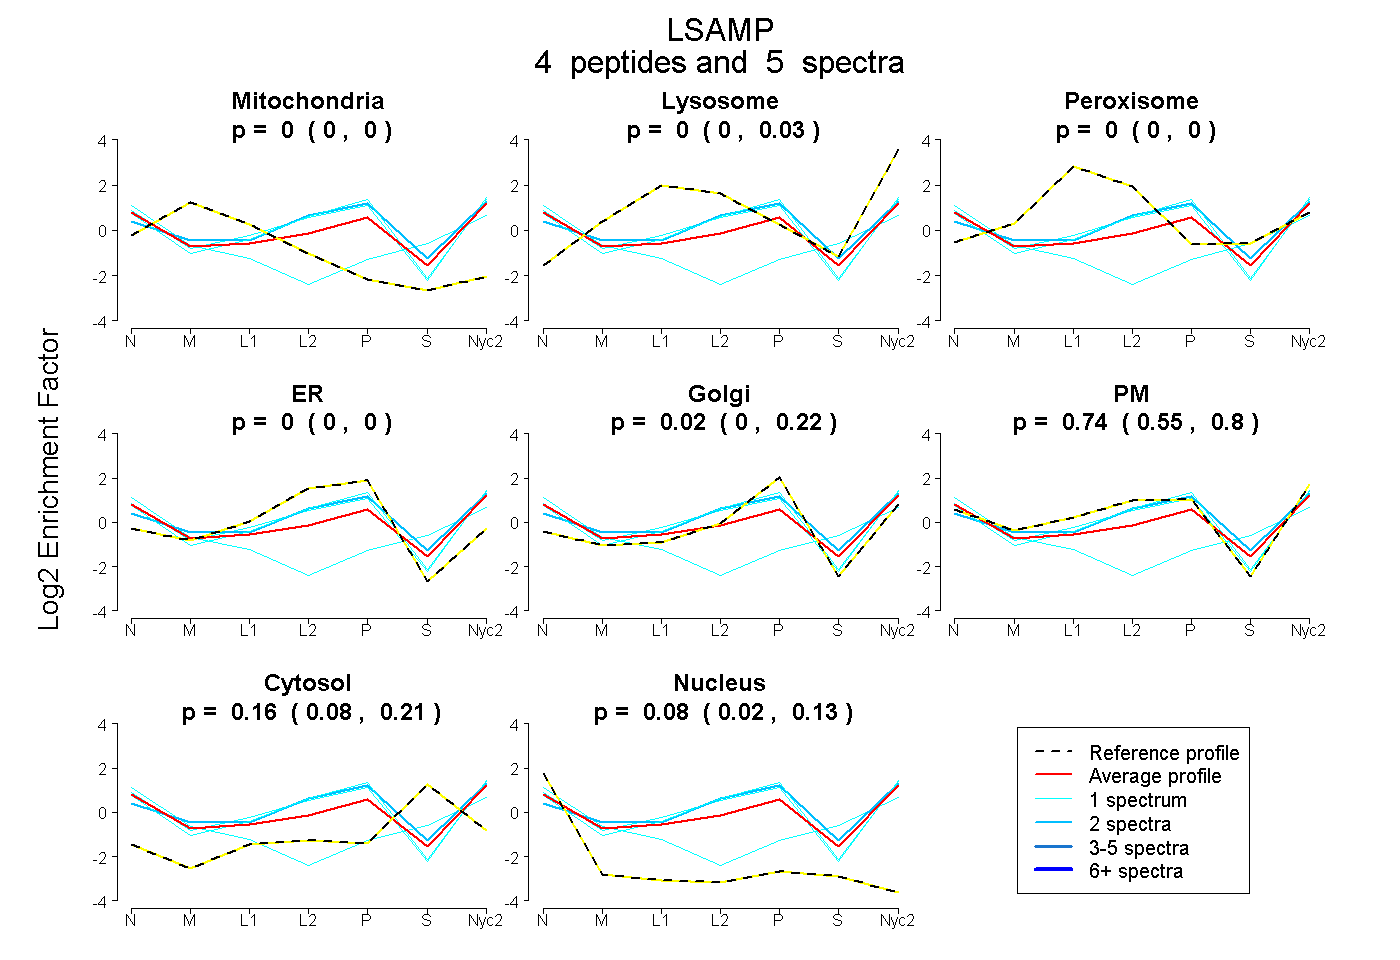
| Expt A |
4 peptides |
5 spectra |
|
0.000 0.000 | 0.000 |
0.000 0.000 | 0.026 |
0.000 0.000 | 0.000 |
0.000 0.000 | 0.000 |
0.023 0.000 | 0.225 |
0.742 0.552 | 0.796 |
0.157 0.076 | 0.210 |
0.077 0.025 | 0.127 |
||
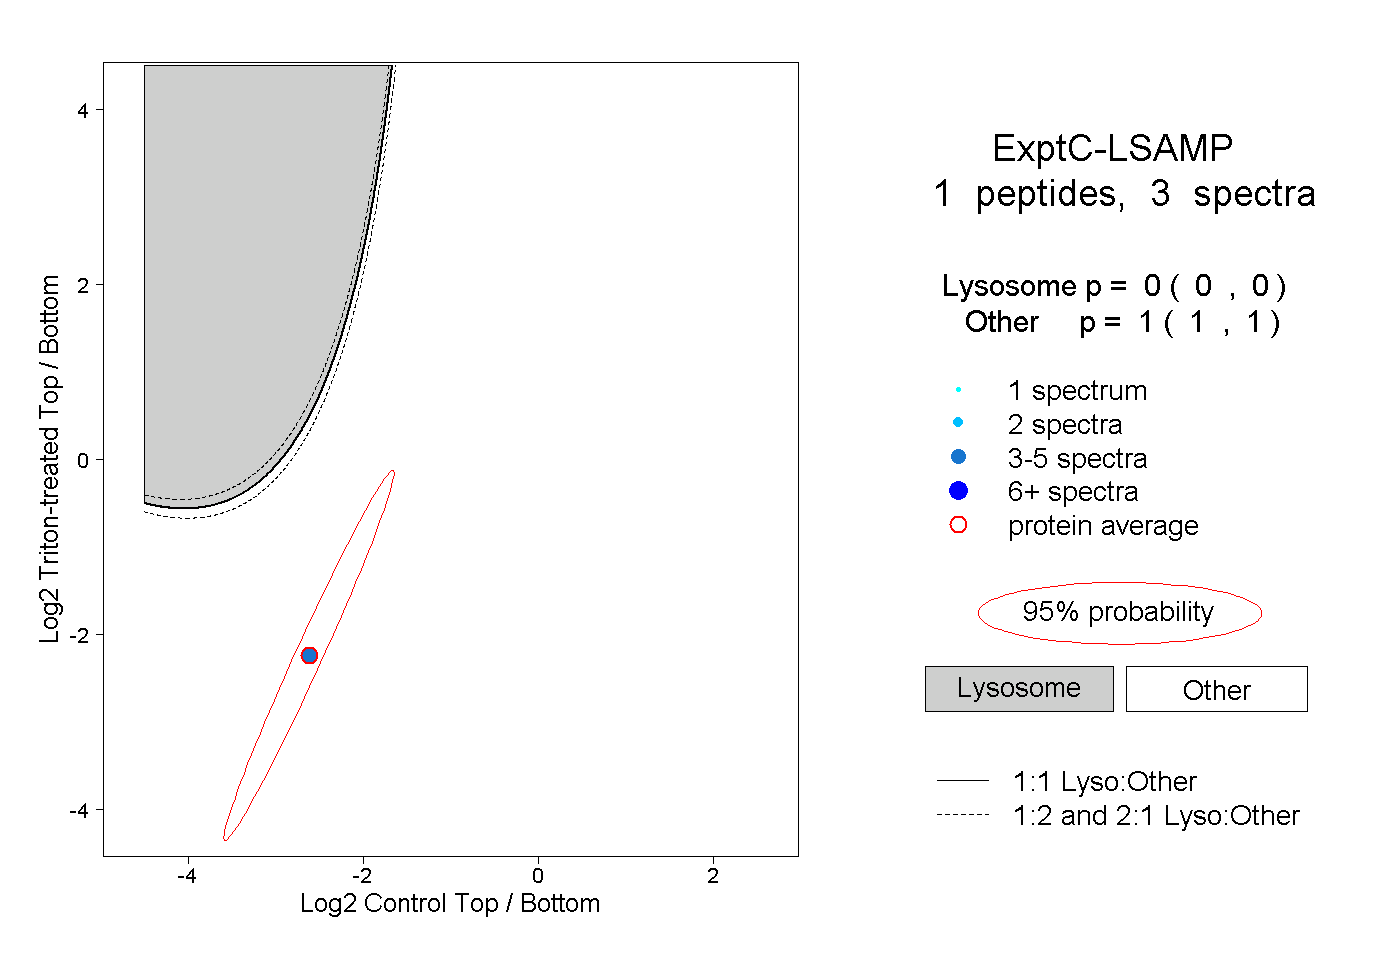
| Plot | Lyso | Other | |||||||||||
| Expt C |
1 peptide |
3 spectra |
|
0.000 0.000 | 0.000 |
1.000 1.000 | 1.000 |