 8
8peptides
spectra
0.000 | 0.000
0.002 | 0.028
0.000 | 0.009
0.000 | 0.000
0.000 | 0.010
0.070 | 0.094
0.888 | 0.903
0.000 | 0.000
| Plot | Mito | Lyso | Perox | ER | Golgi | PM | Cytosol | Nucleus | |||||
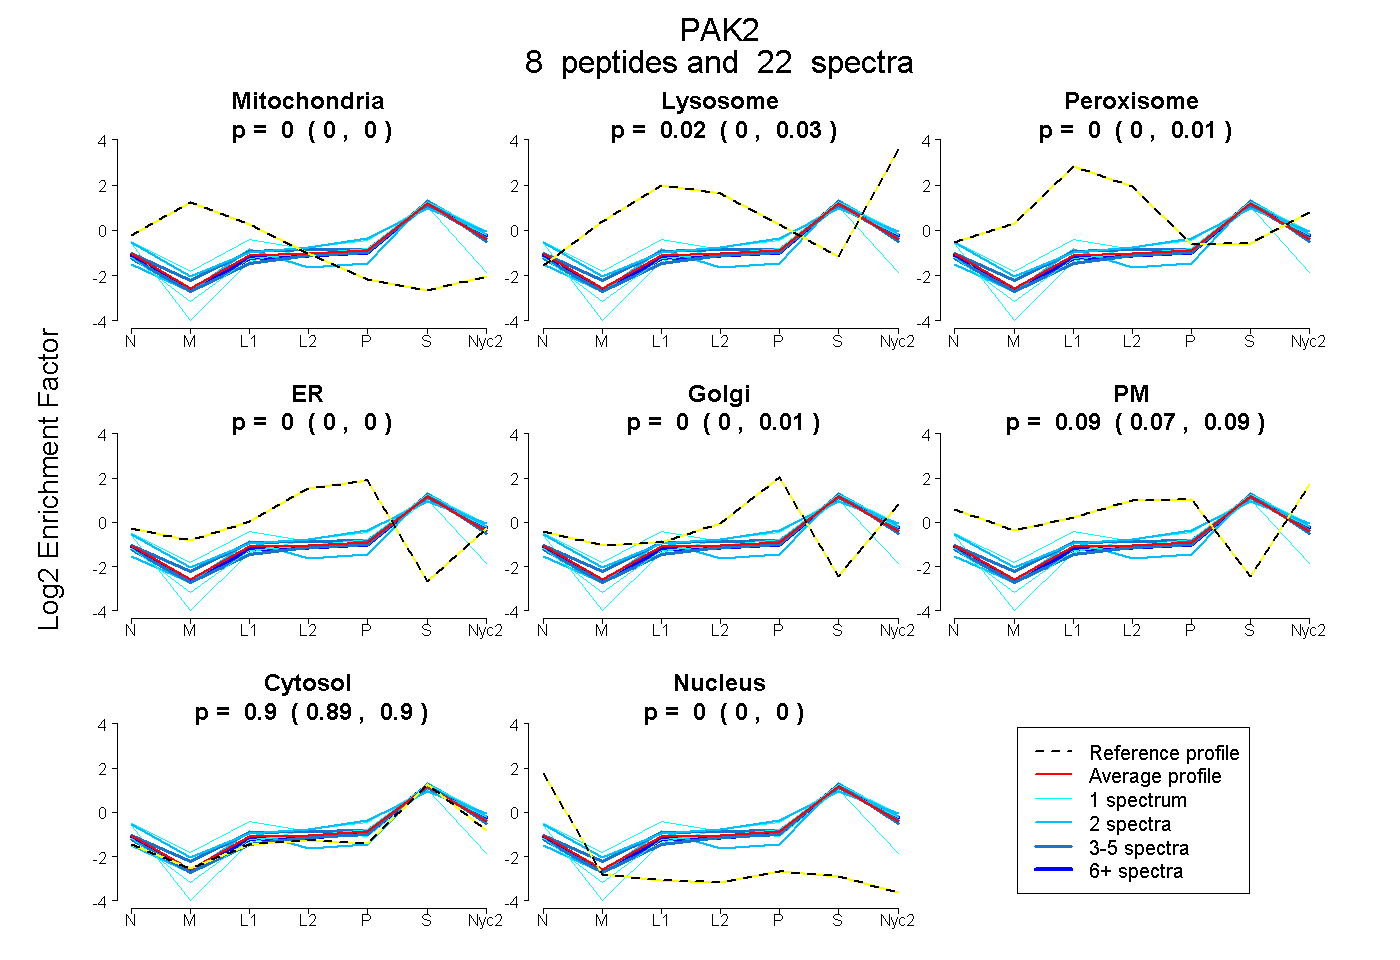
| Expt A |
8 peptides |
22 spectra |
|
0.000 0.000 | 0.000 |
0.018 0.002 | 0.028 |
0.000 0.000 | 0.009 |
0.000 0.000 | 0.000 |
0.000 0.000 | 0.010 |
0.086 0.070 | 0.094 |
0.897 0.888 | 0.903 |
0.000 0.000 | 0.000 |
| 1 spectrum, SDNVLLGMEGSVK | 0.000 | 0.041 | 0.000 | 0.000 | 0.054 | 0.000 | 0.905 | 0.000 | ||
| 8 spectra, ELLQHPFLK | 0.000 | 0.031 | 0.000 | 0.000 | 0.001 | 0.056 | 0.912 | 0.000 | ||
| 2 spectra, IISIFSSTEK | 0.000 | 0.054 | 0.000 | 0.000 | 0.000 | 0.000 | 0.946 | 0.000 | ||
| 1 spectrum, ECLQALEFLHANQVIHR | 0.021 | 0.000 | 0.185 | 0.000 | 0.000 | 0.000 | 0.682 | 0.112 | ||
| 4 spectra, MTDEEIMEK | 0.000 | 0.018 | 0.062 | 0.000 | 0.007 | 0.075 | 0.838 | 0.000 | ||
| 1 spectrum, LLQTSNITK | 0.000 | 0.000 | 0.000 | 0.000 | 0.119 | 0.000 | 0.881 | 0.000 | ||
| 3 spectra, LSPIFR | 0.000 | 0.005 | 0.000 | 0.000 | 0.059 | 0.000 | 0.937 | 0.000 | ||
| 2 spectra, TIVSIGDPK | 0.000 | 0.000 | 0.000 | 0.000 | 0.000 | 0.244 | 0.756 | 0.000 |
| Plot | Mito | Lyso or Perox | ER | Golgi | PM | Cytosol | Nucleus | ||||||
| Expt B |
3 peptides |
5 spectra |
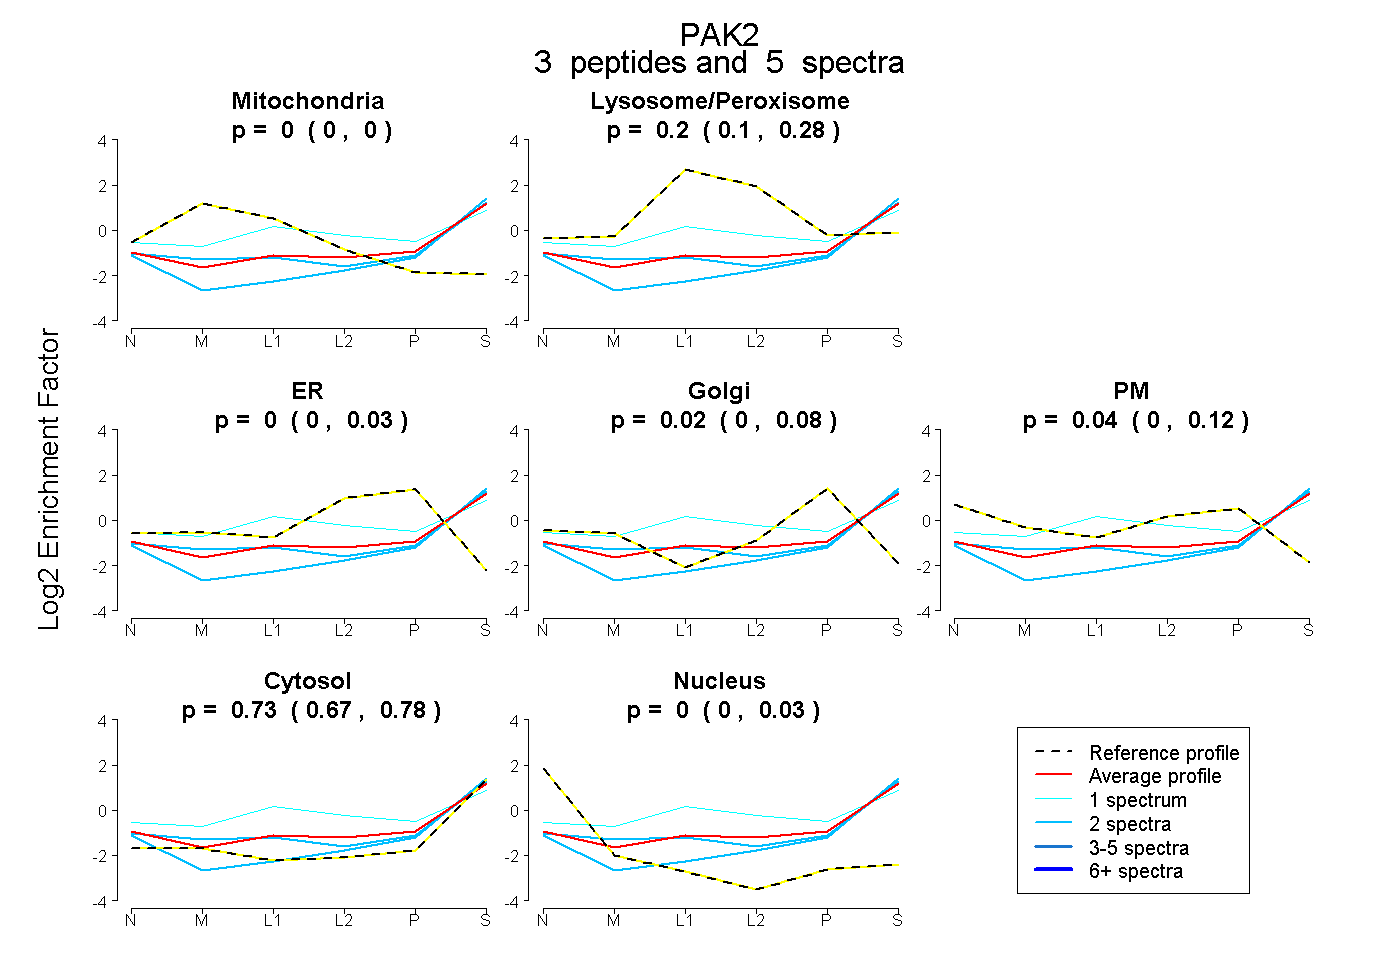 |
0.000 0.000 | 0.000 |
0.203 0.098 | 0.283 |
0.000 0.000 | 0.026 |
0.025 0.000 | 0.084 |
0.039 0.000 | 0.118 |
0.733 0.675 | 0.776 |
0.000 0.000 | 0.034 |
|||
| Plot | Lyso | Other | |||||||||||
| Expt C |
6 peptides |
22 spectra |
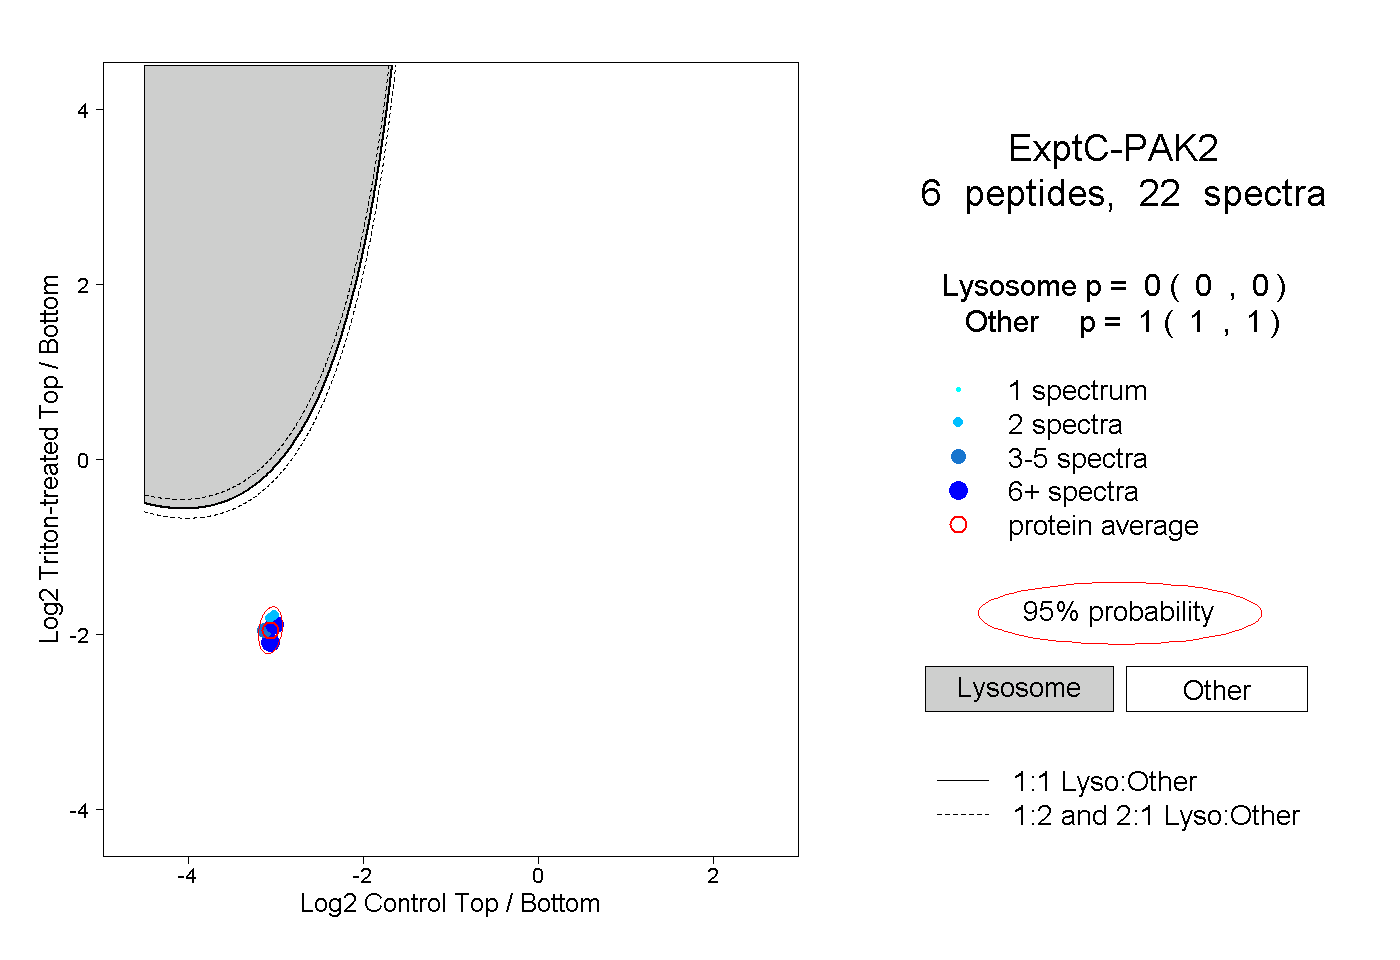 |
0.000 0.000 | 0.000 |
1.000 1.000 | 1.000 |
||||||||
| Plot | Lyso | Other | |||||||||||
| Expt D |
1 peptide |
1 spectrum |
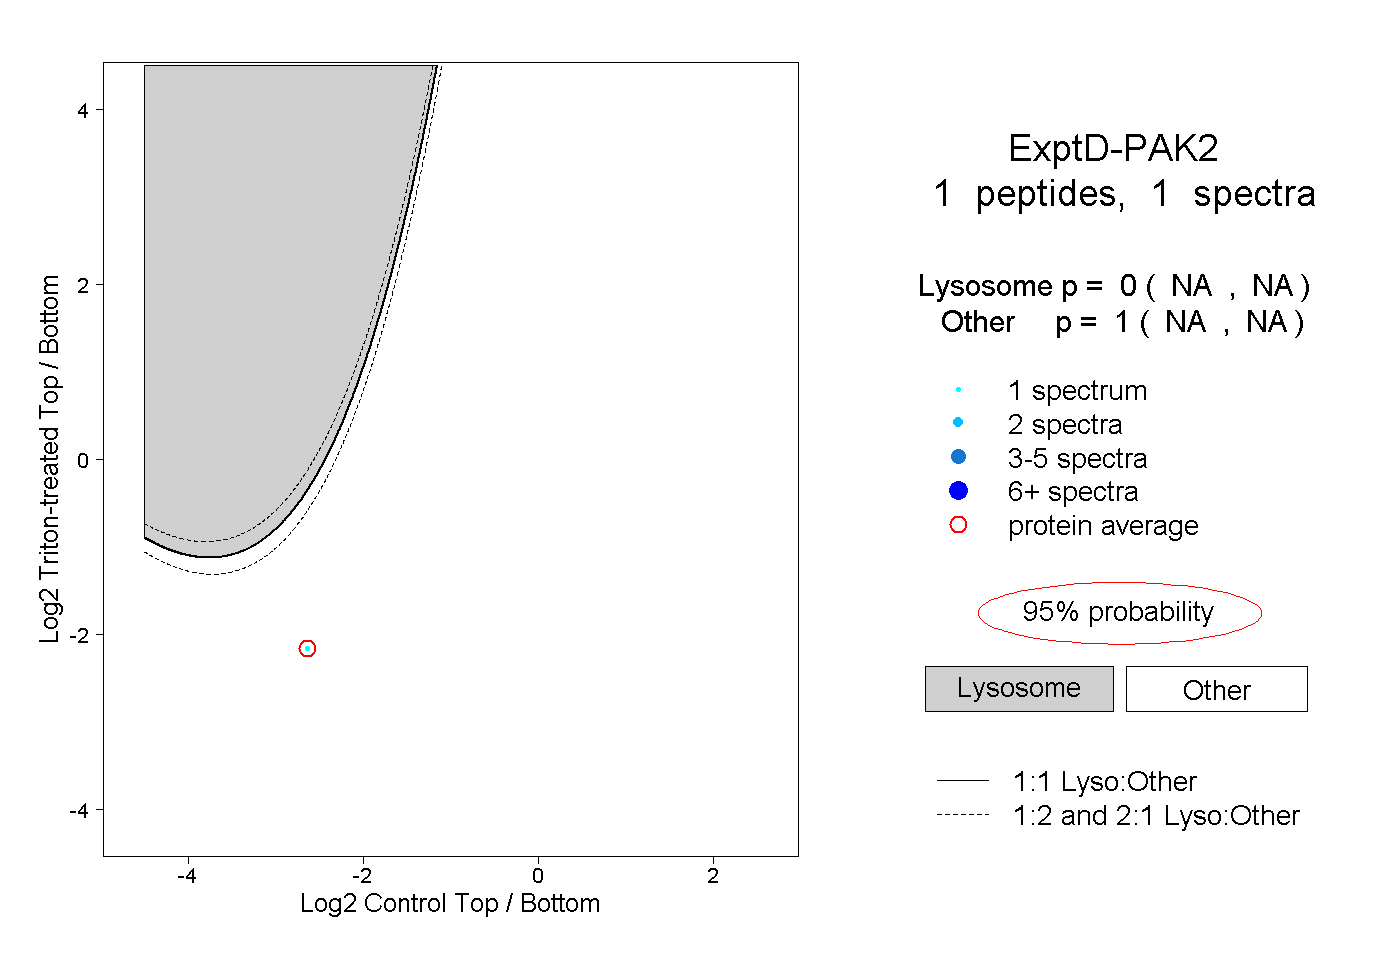 |
0.000 NA | NA |
1.000 NA | NA |