 35
35peptides
spectra
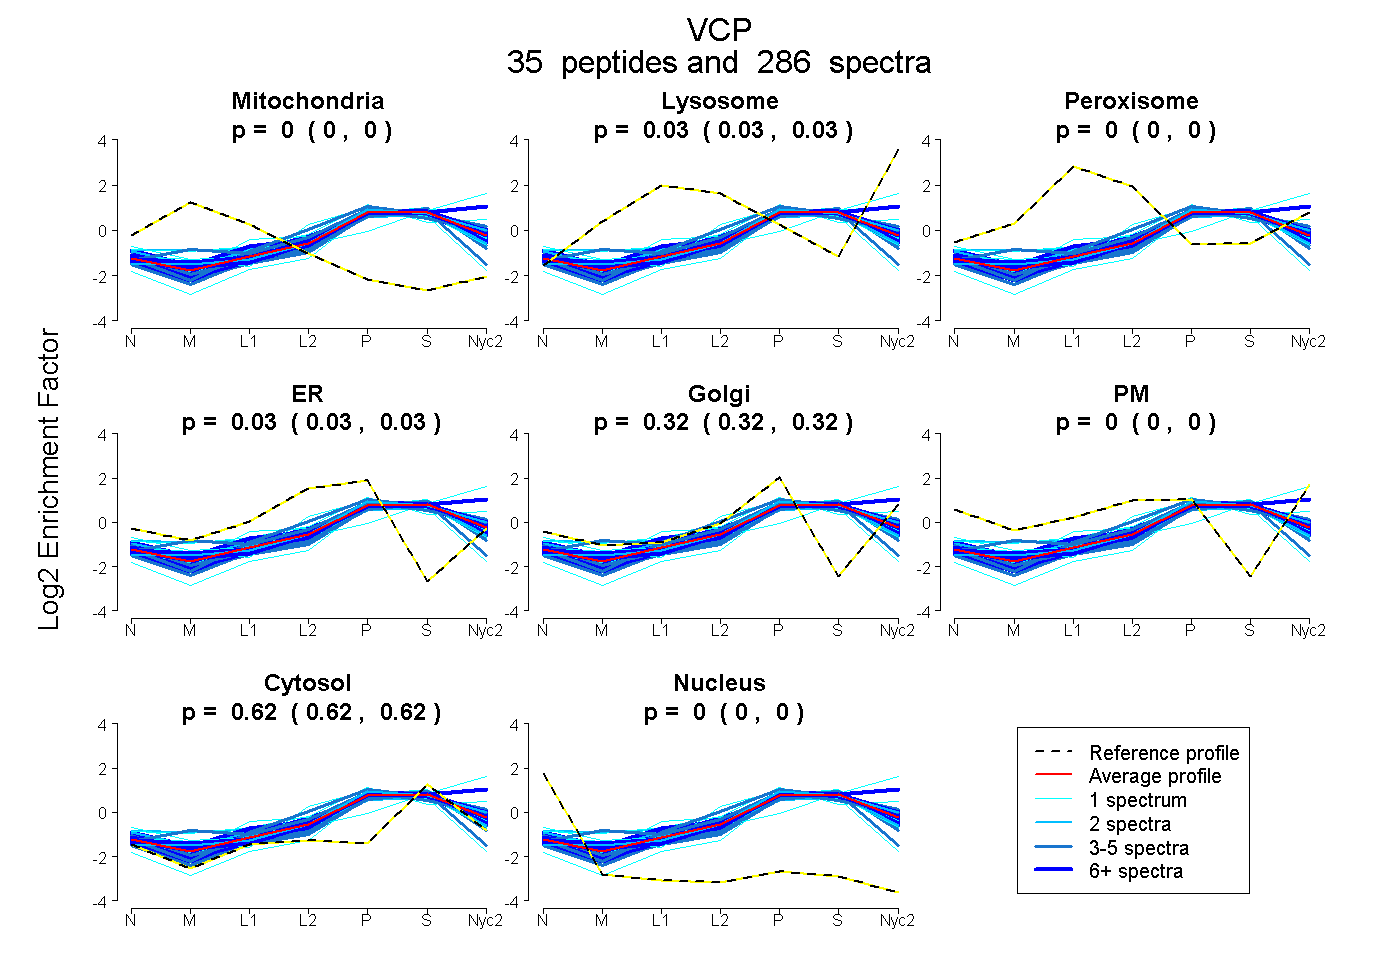
0.000 | 0.000
0.026 | 0.029
0.000 | 0.000
0.026 | 0.033
0.316 | 0.323
0.000 | 0.000
0.622 | 0.624
0.000 | 0.000
30peptides
spectra
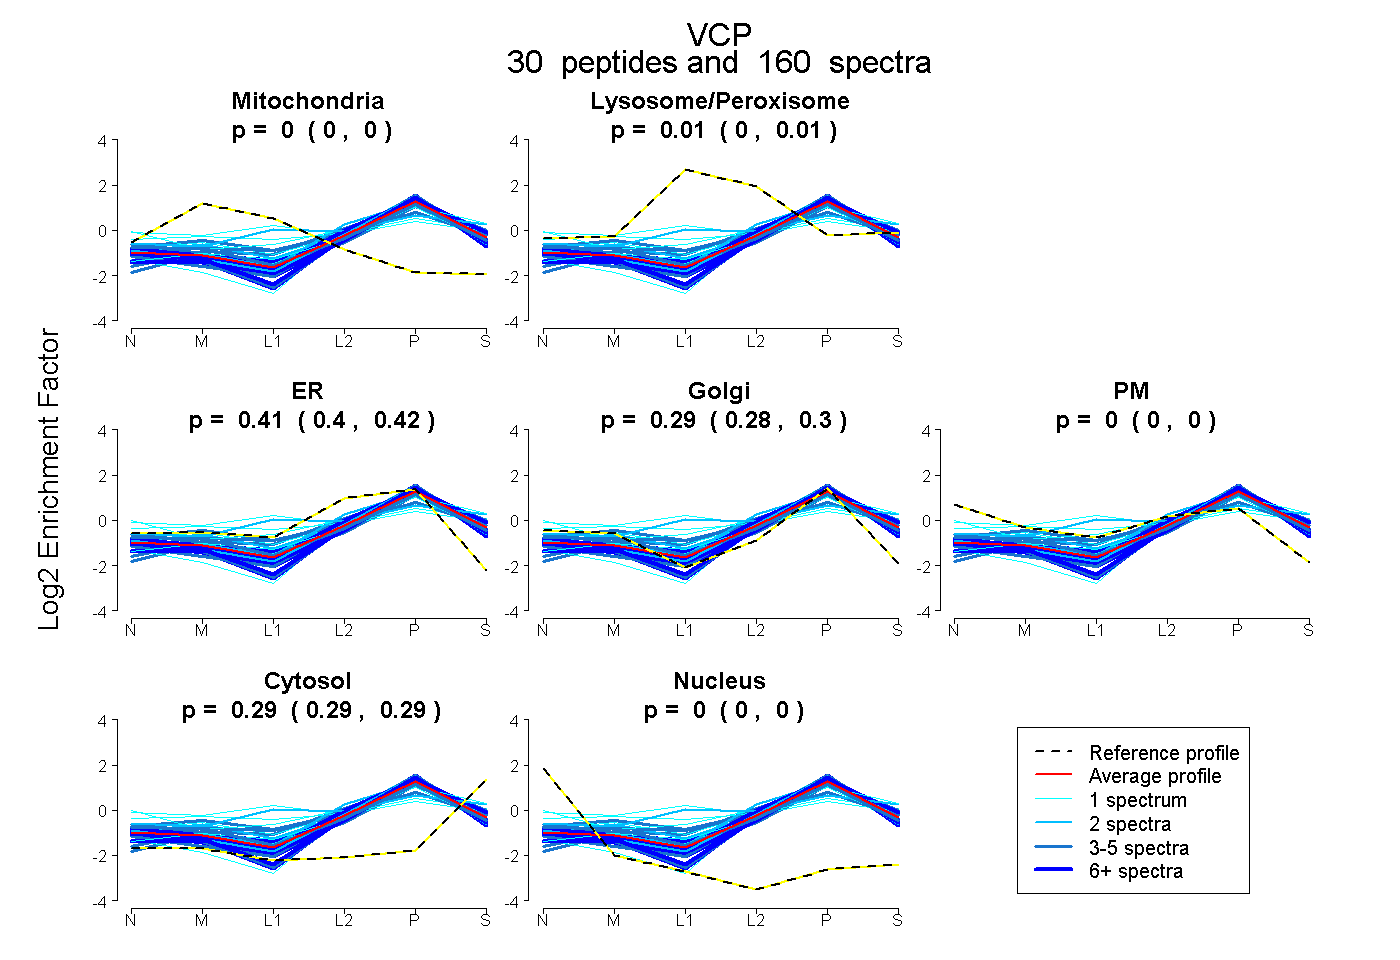
0.000 | 0.000
0.004 | 0.014
0.402 | 0.420
0.281 | 0.295
0.000 | 0.000
0.287 | 0.293
0.000 | 0.000
30peptides
spectra
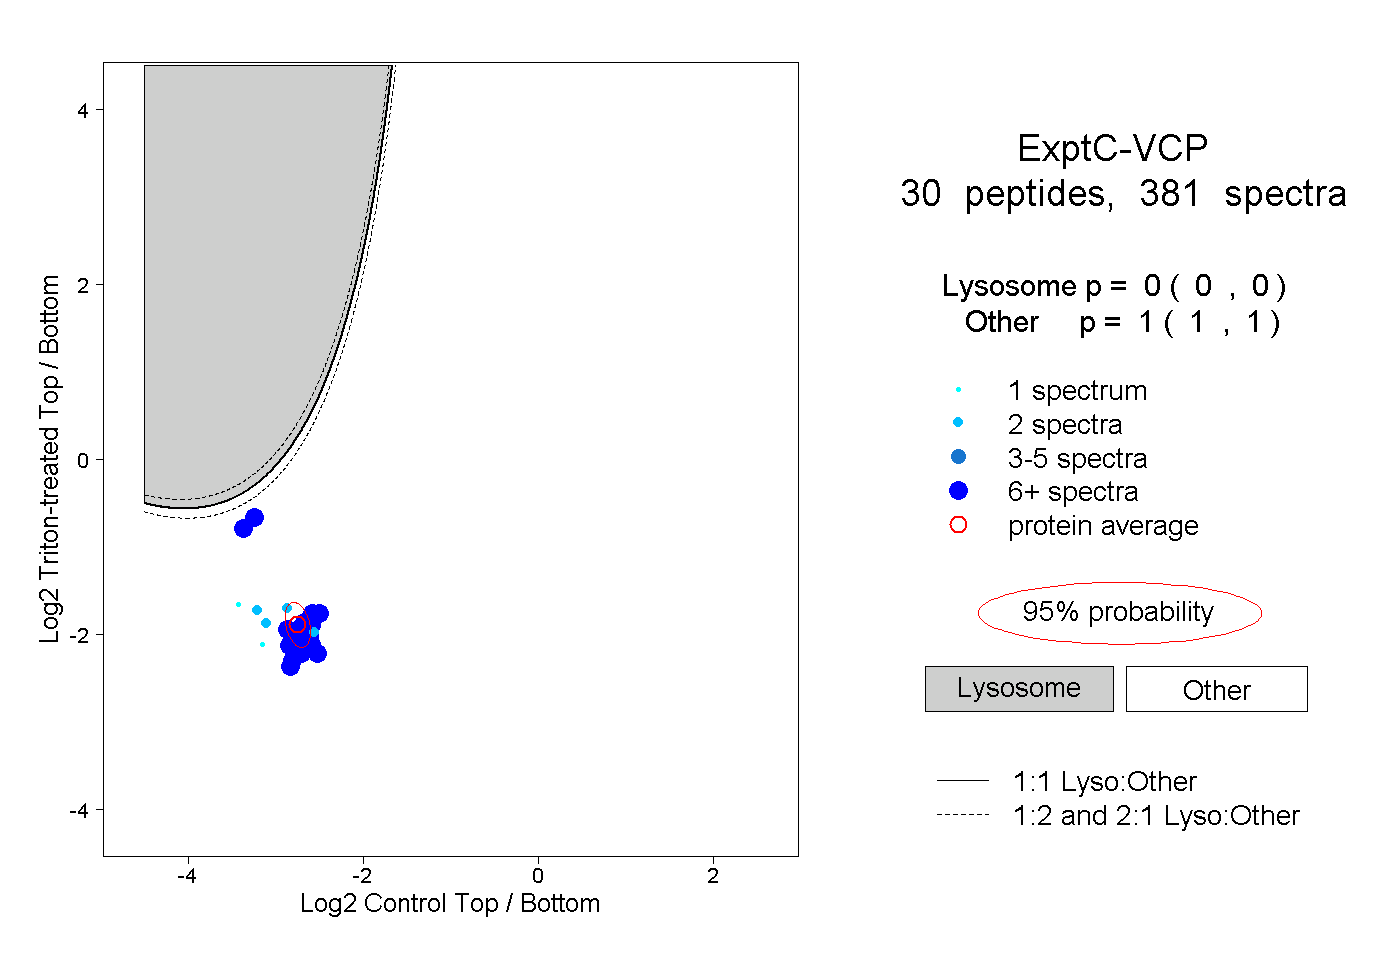
0.000 | 0.000
1.000 | 1.000
20peptides
spectra
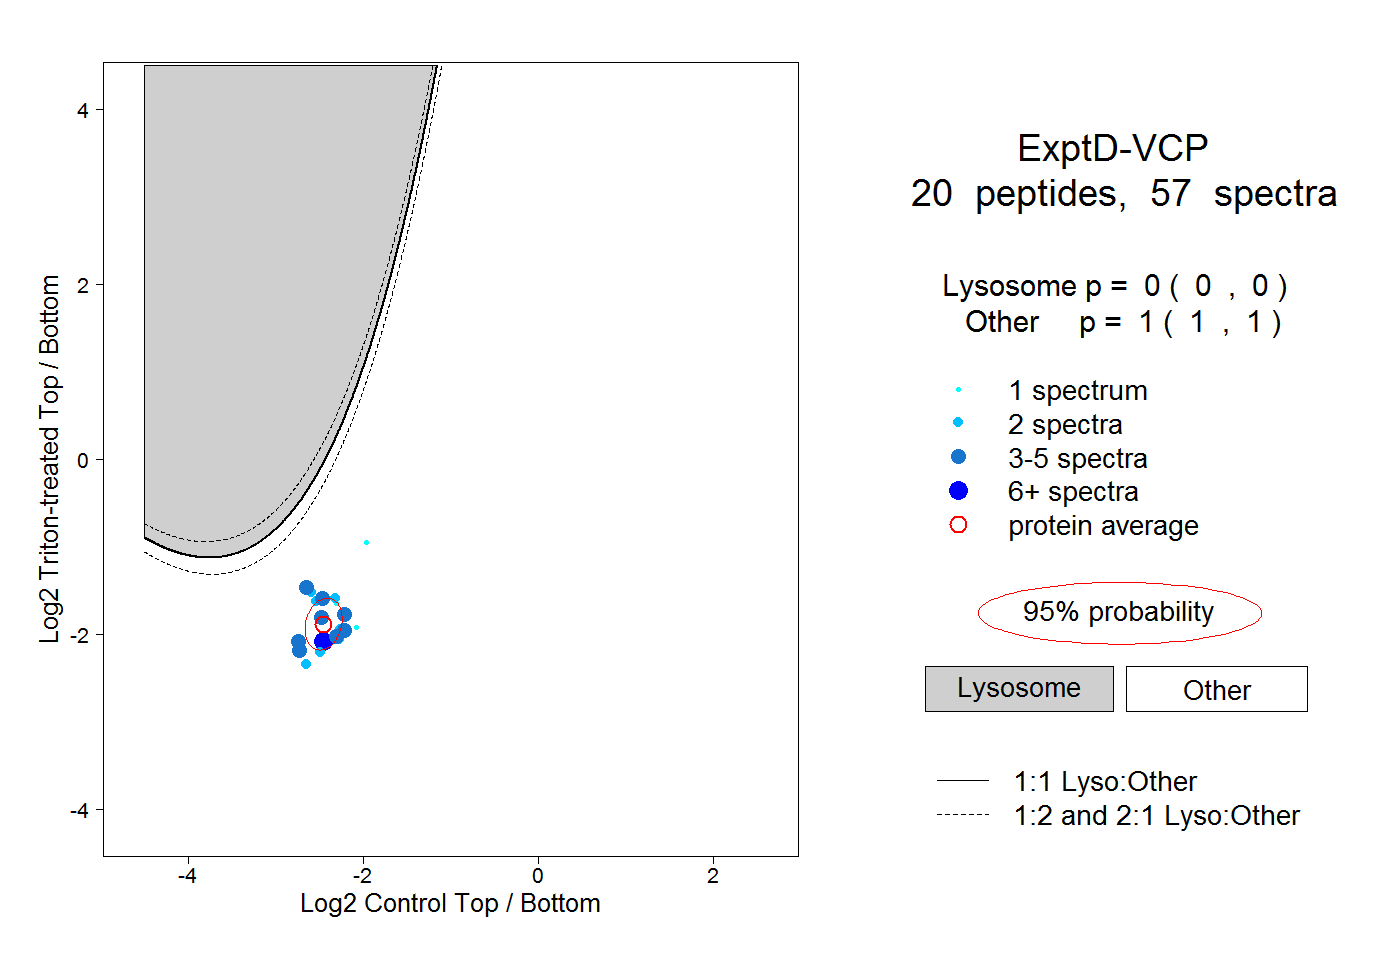
0.000 | 0.000
1.000 | 1.000