 4
4peptides
spectra
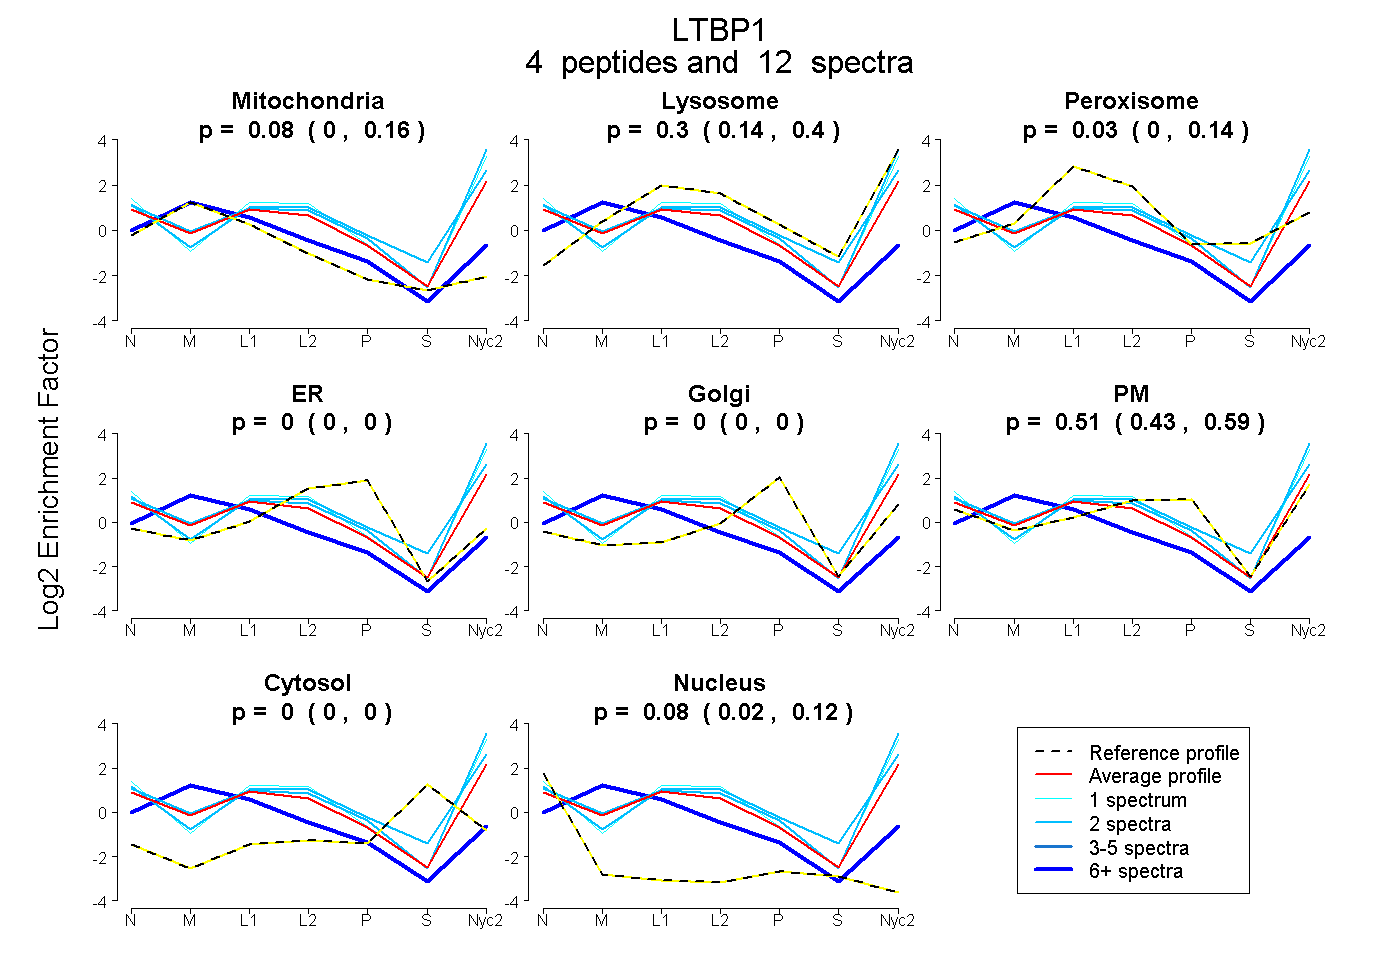
0.000 | 0.158
0.136 | 0.400
0.000 | 0.137
0.000 | 0.000
0.000 | 0.000
0.434 | 0.593
0.000 | 0.000
0.017 | 0.123
4peptides
spectra
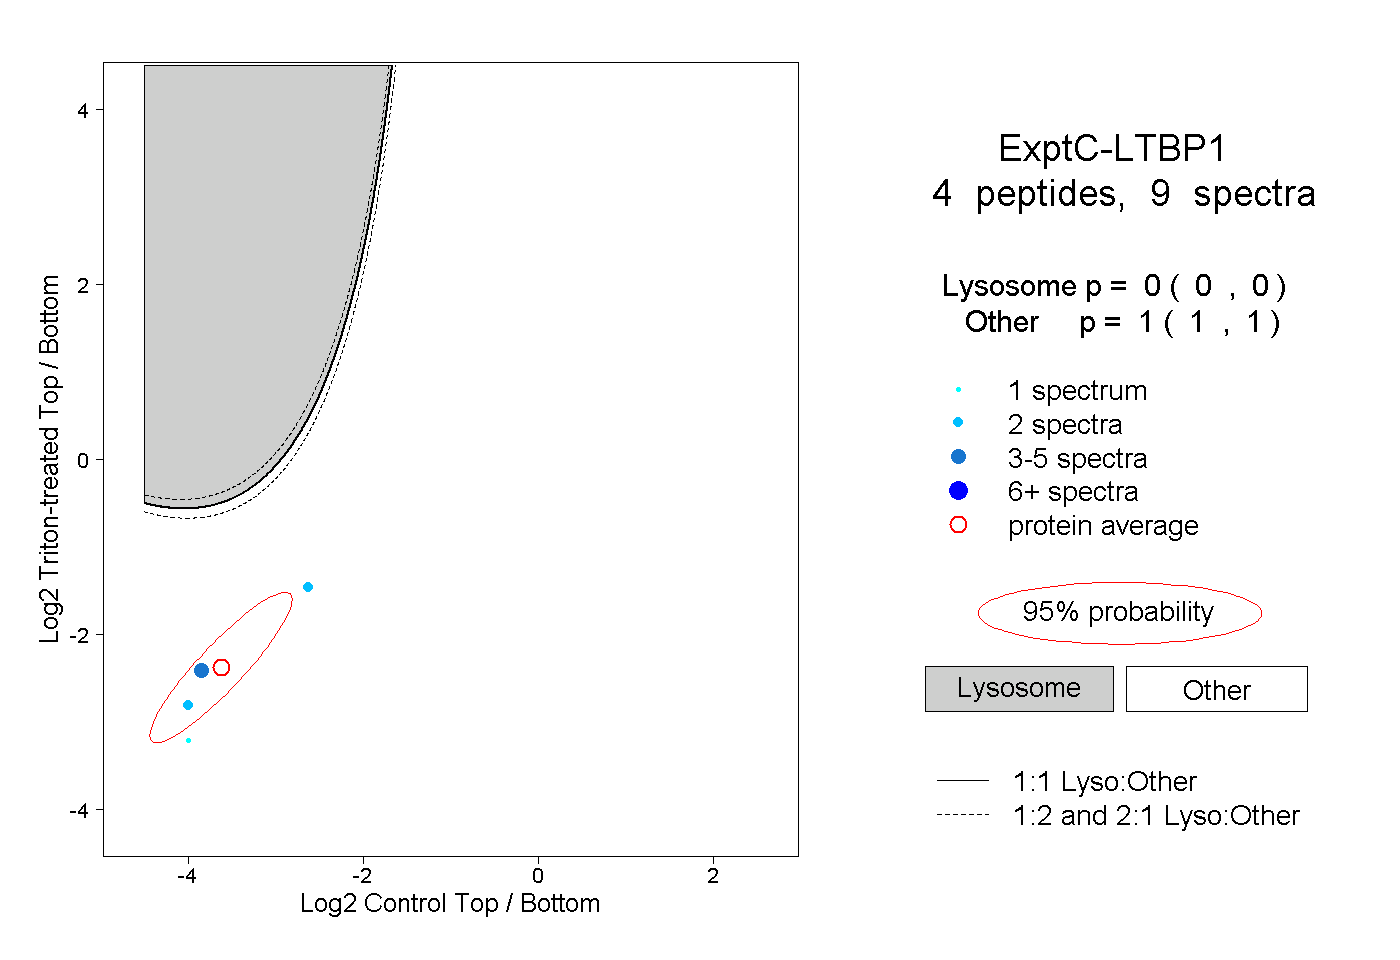
0.000 | 0.000
1.000 | 1.000
3peptides
spectra
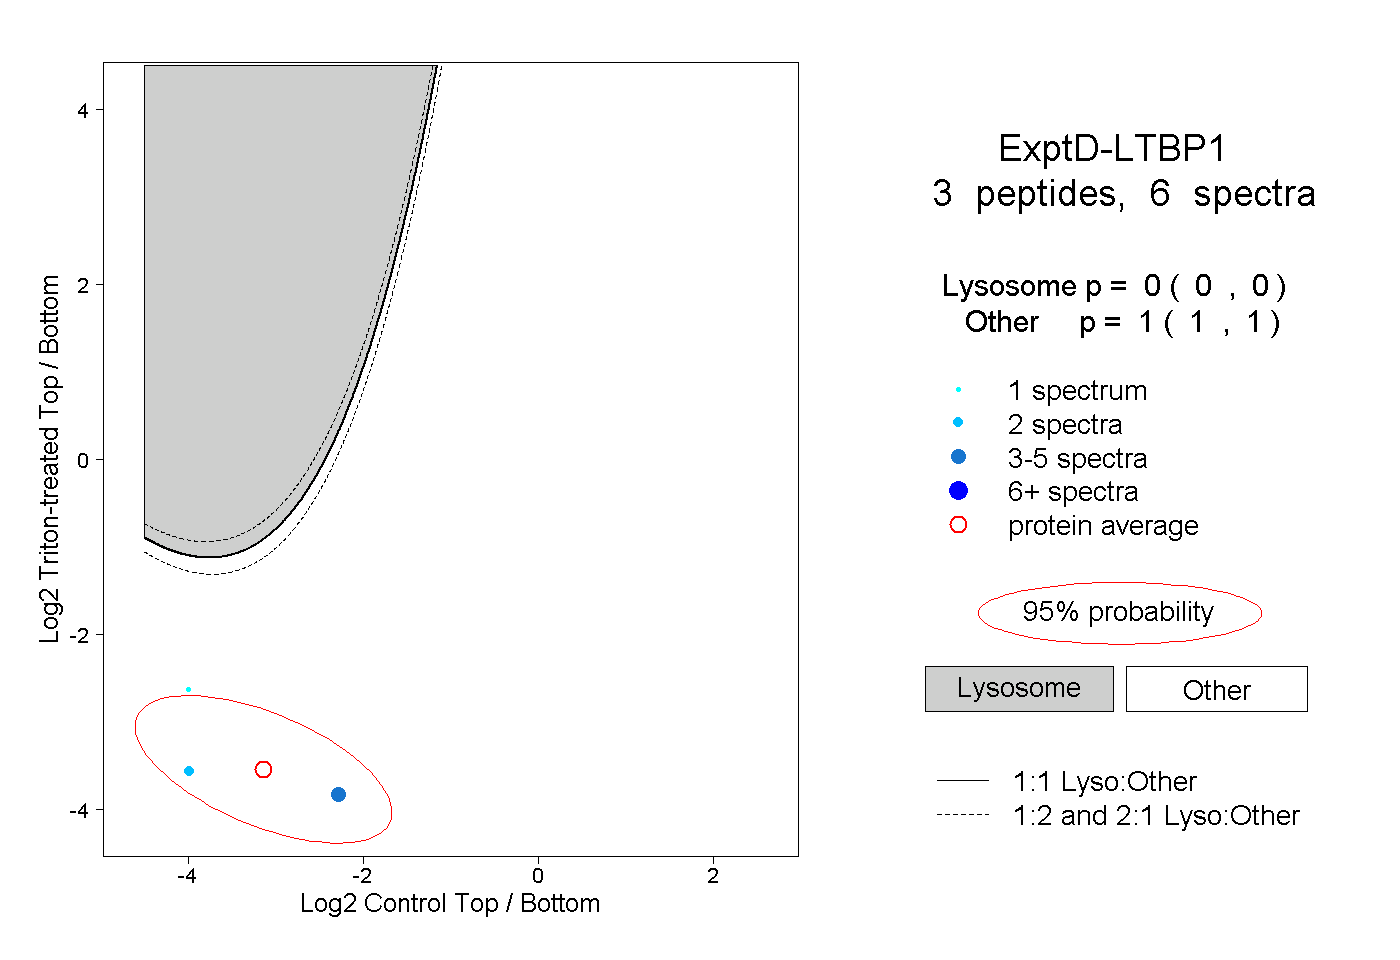
0.000 | 0.000
1.000 | 1.000