 23
23peptides
spectra
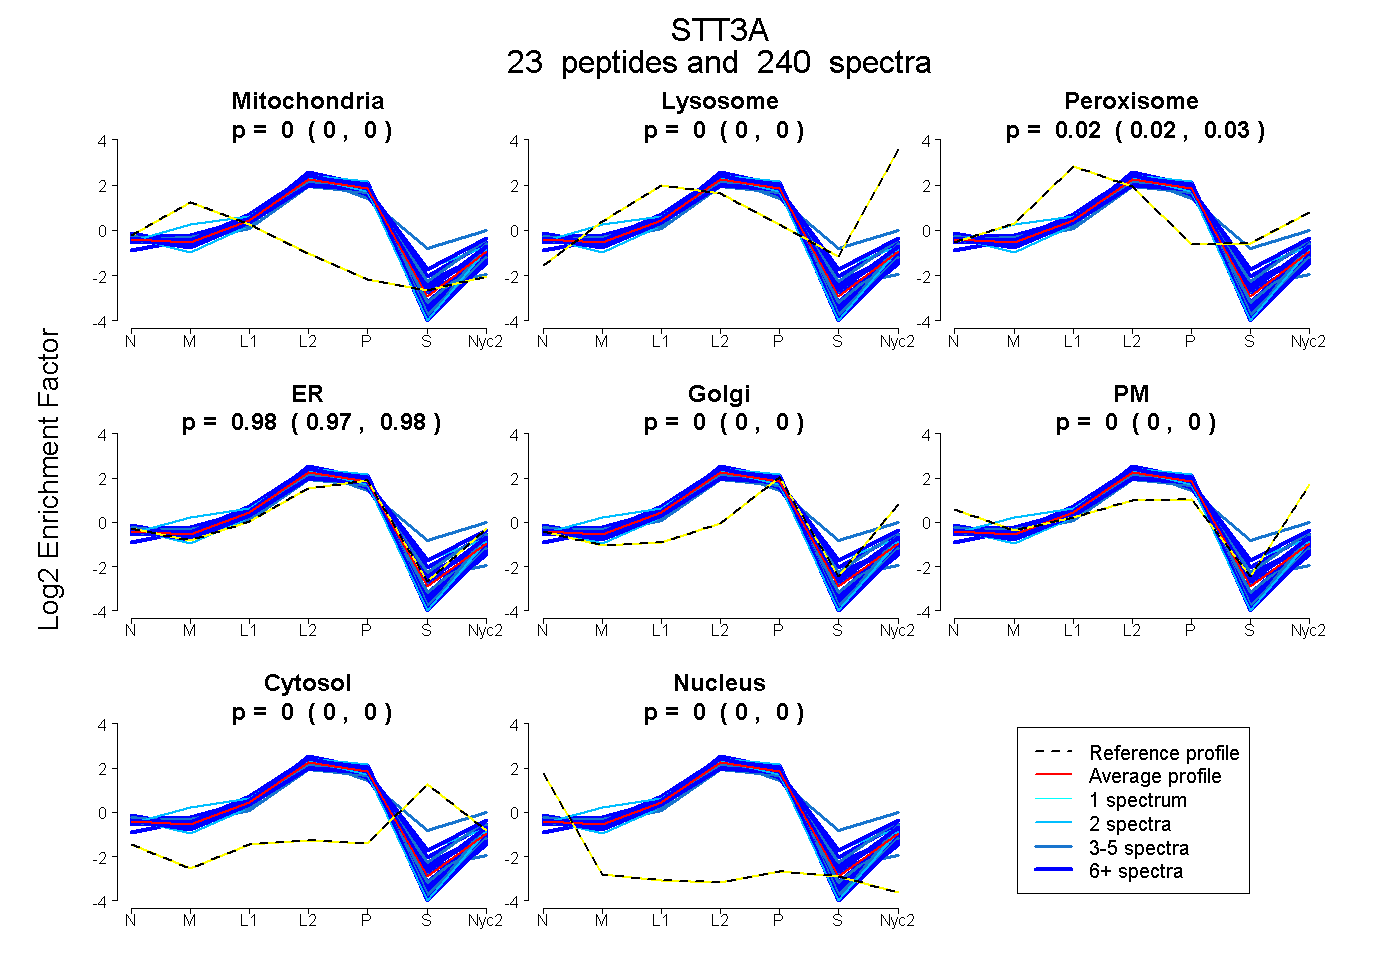
0.000 | 0.001
0.000 | 0.000
0.022 | 0.027
0.973 | 0.977
0.000 | 0.000
0.000 | 0.000
0.000 | 0.000
0.000 | 0.000
20peptides
spectra
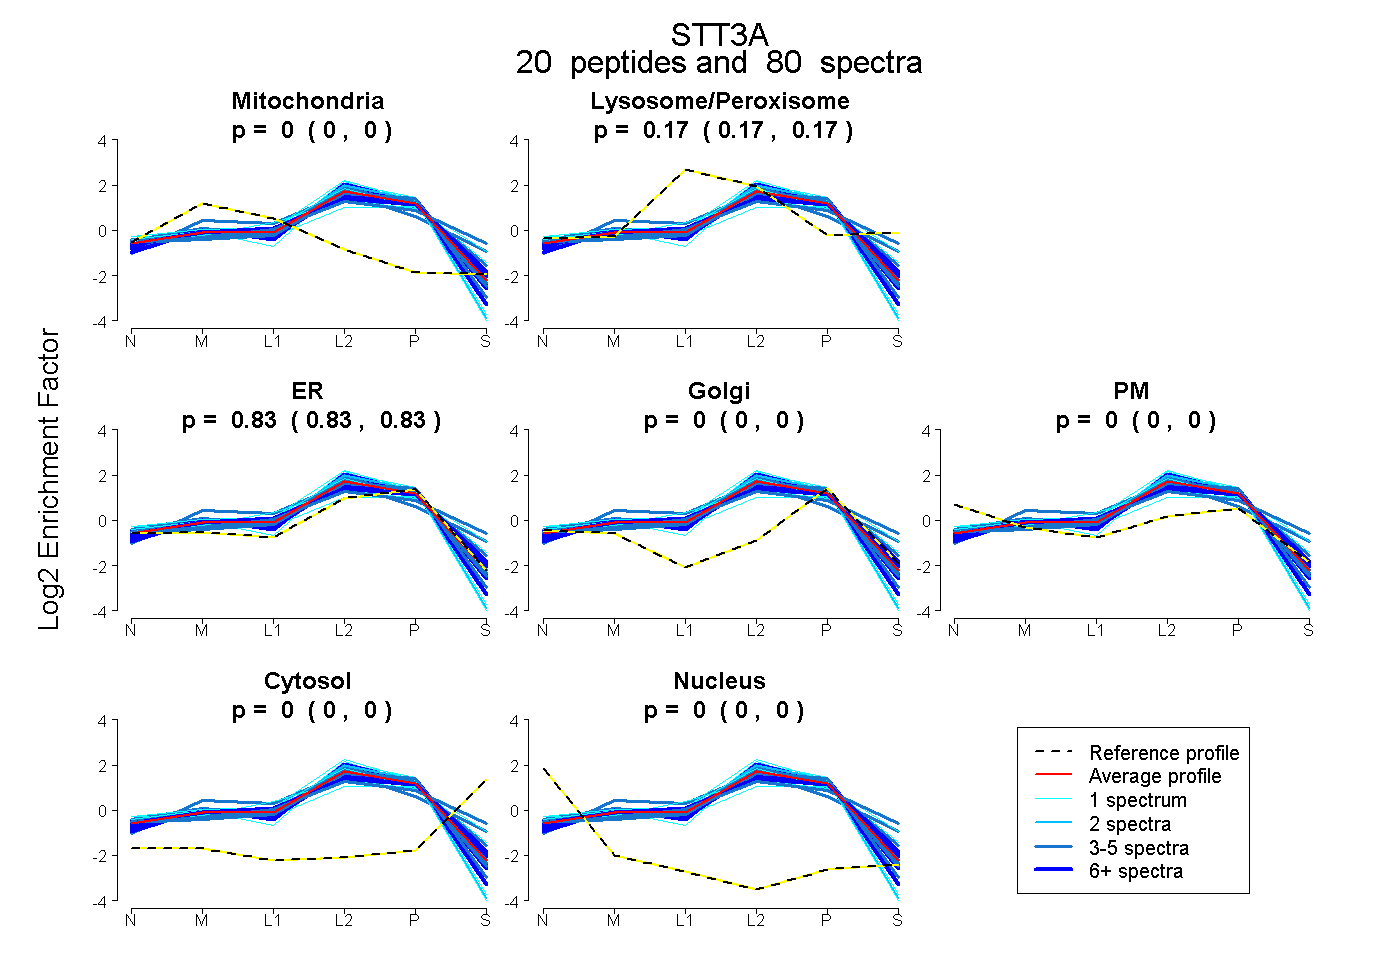
0.000 | 0.000
0.166 | 0.174
0.825 | 0.834
0.000 | 0.000
0.000 | 0.000
0.000 | 0.000
0.000 | 0.000
23peptides
spectra
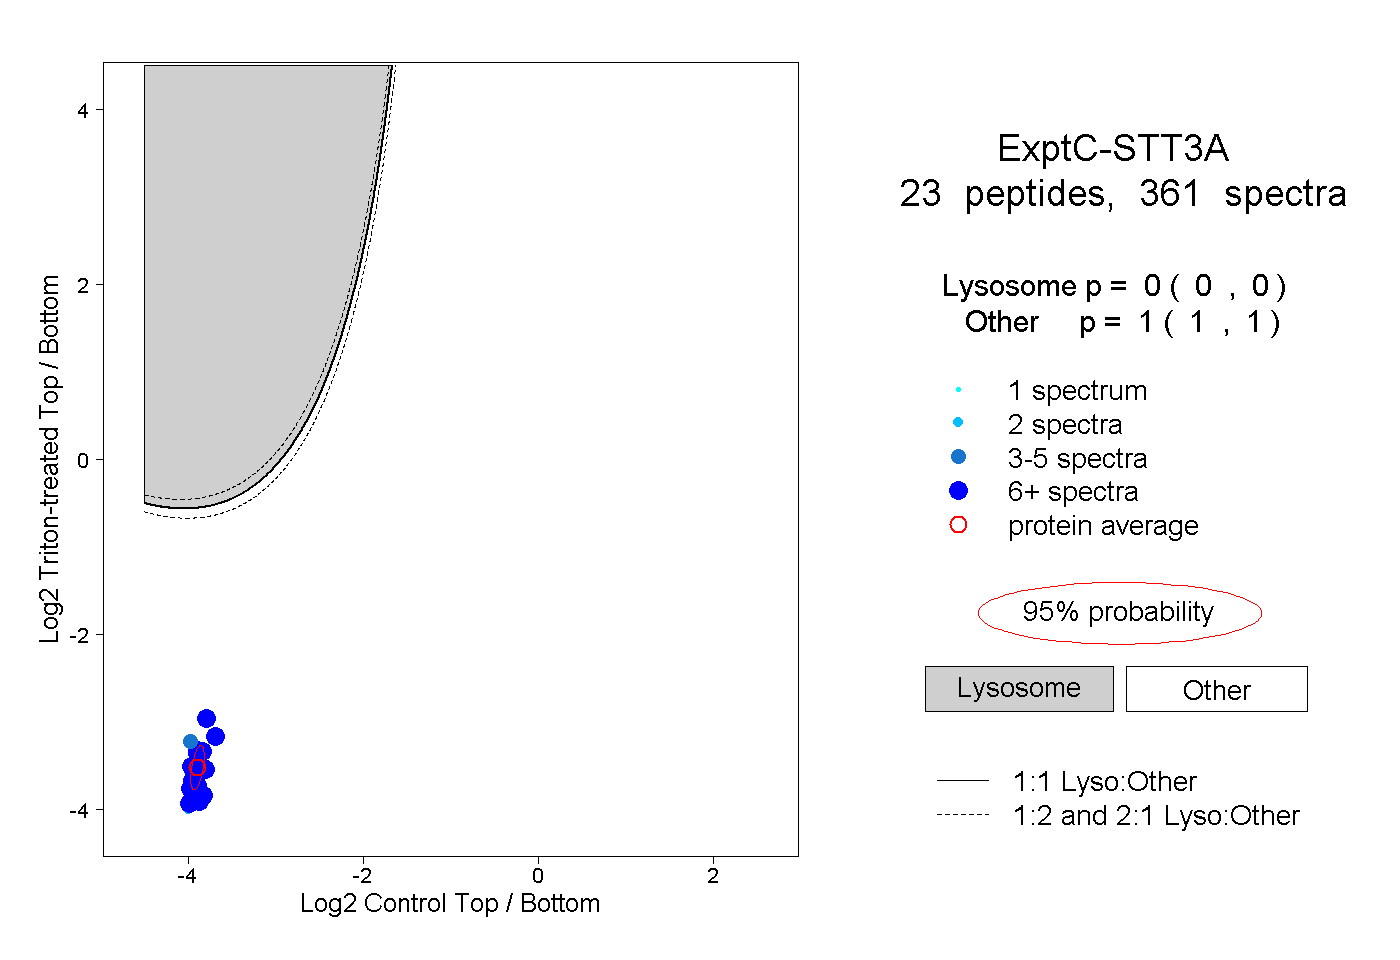
0.000 | 0.000
1.000 | 1.000
18peptides
spectra
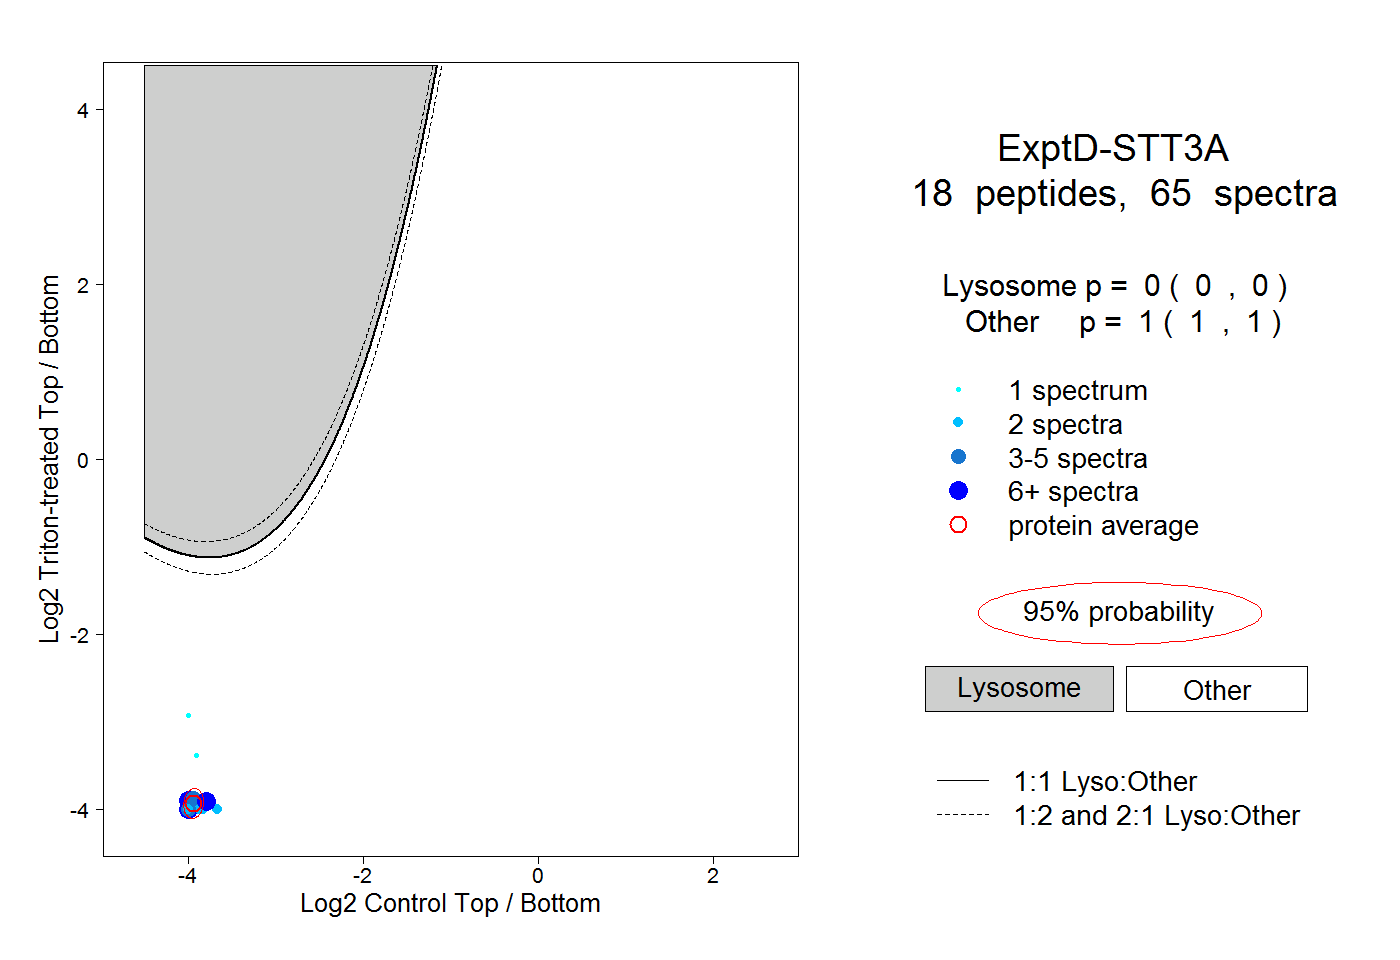
0.000 | 0.000
1.000 | 1.000