 4
4peptides
spectra
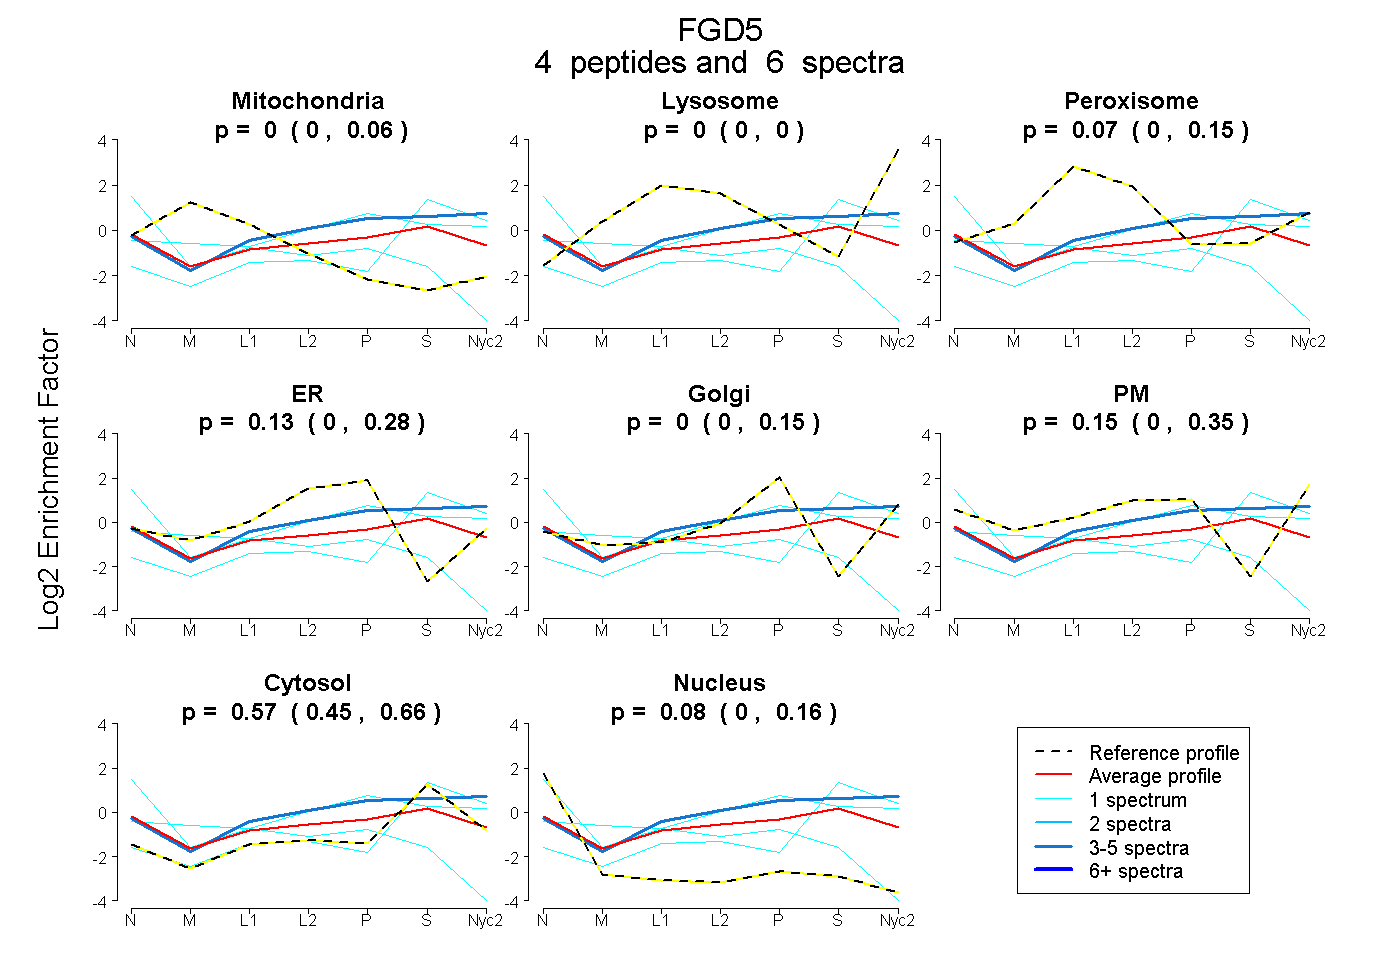
0.000 | 0.063
0.000 | 0.000
0.000 | 0.151
0.000 | 0.279
0.000 | 0.149
0.000 | 0.355
0.453 | 0.658
0.000 | 0.162
2peptides
spectra
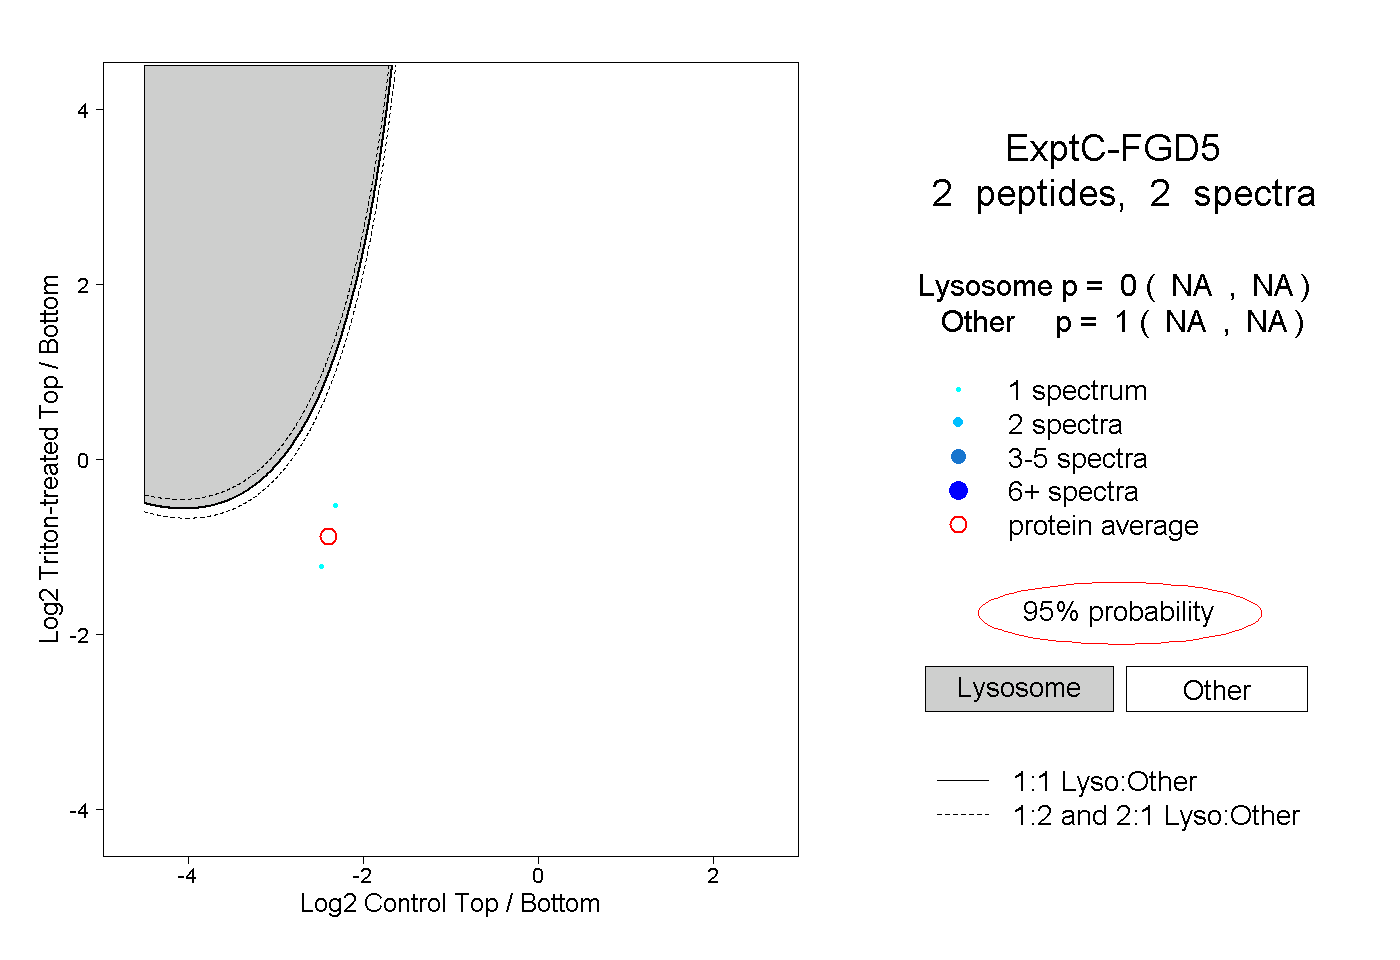
NA | NA
NA | NA
| Plot | Mito | Lyso | Perox | ER | Golgi | PM | Cytosol | Nucleus | |||||
| Expt A |
4 peptides |
6 spectra |
|
0.000 0.000 | 0.063 |
0.000 0.000 | 0.000 |
0.069 0.000 | 0.151 |
0.127 0.000 | 0.279 |
0.000 0.000 | 0.149 |
0.152 0.000 | 0.355 |
0.575 0.453 | 0.658 |
0.077 0.000 | 0.162 |
||
| Plot | Lyso | Other | |||||||||||
| Expt C |
2 peptides |
2 spectra |
|
0.000 NA | NA |
1.000 NA | NA |