17
17peptides
spectra
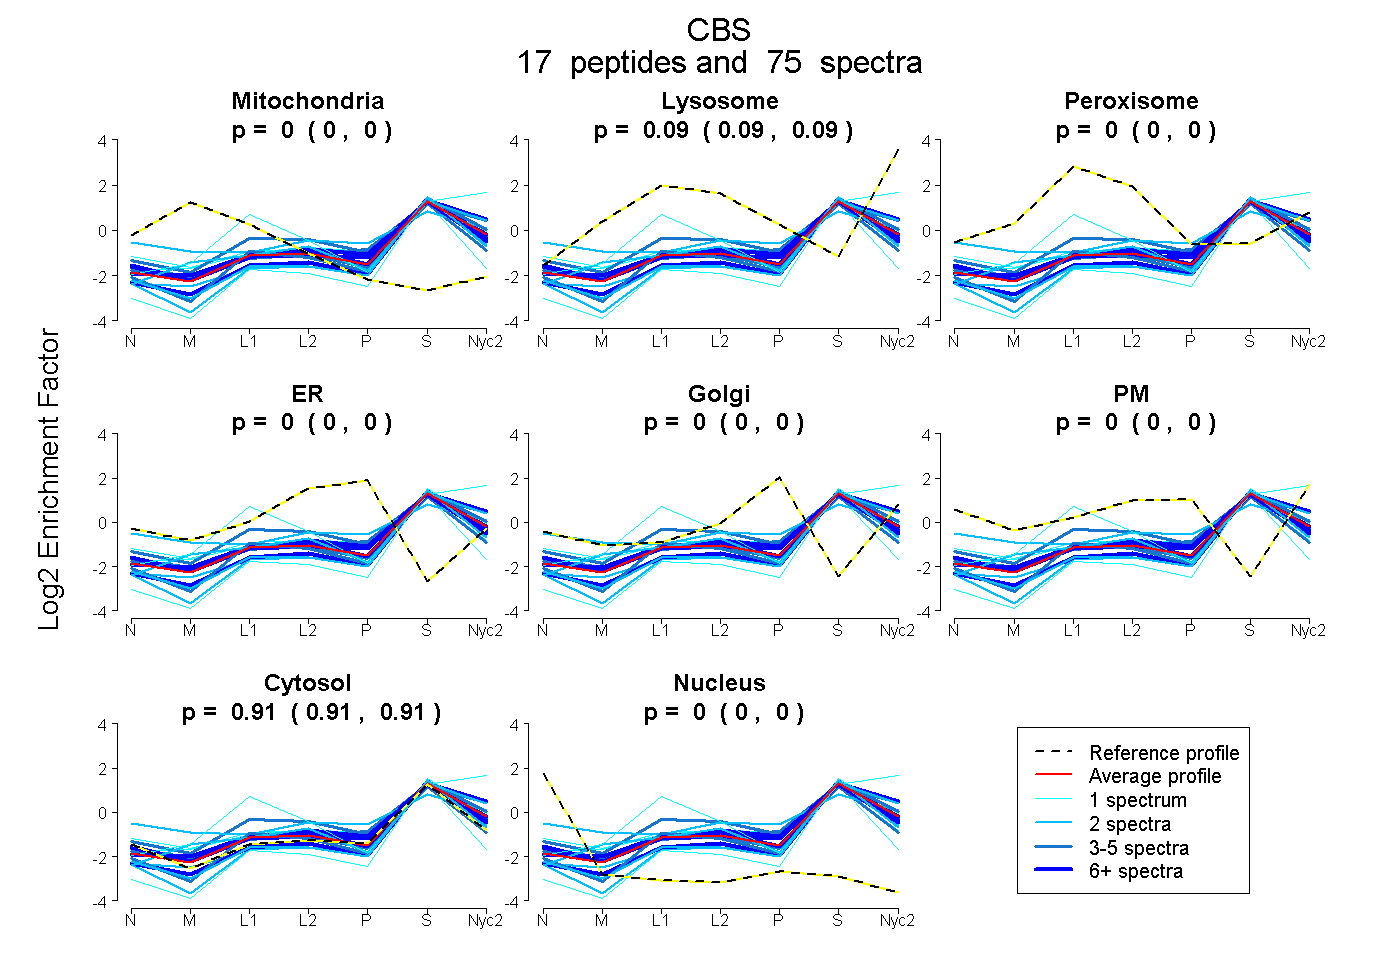
0.000 | 0.000
0.086 | 0.093
0.000 | 0.000
0.000 | 0.000
0.000 | 0.000
0.000 | 0.000
0.906 | 0.914
0.000 | 0.000
10peptides
spectra
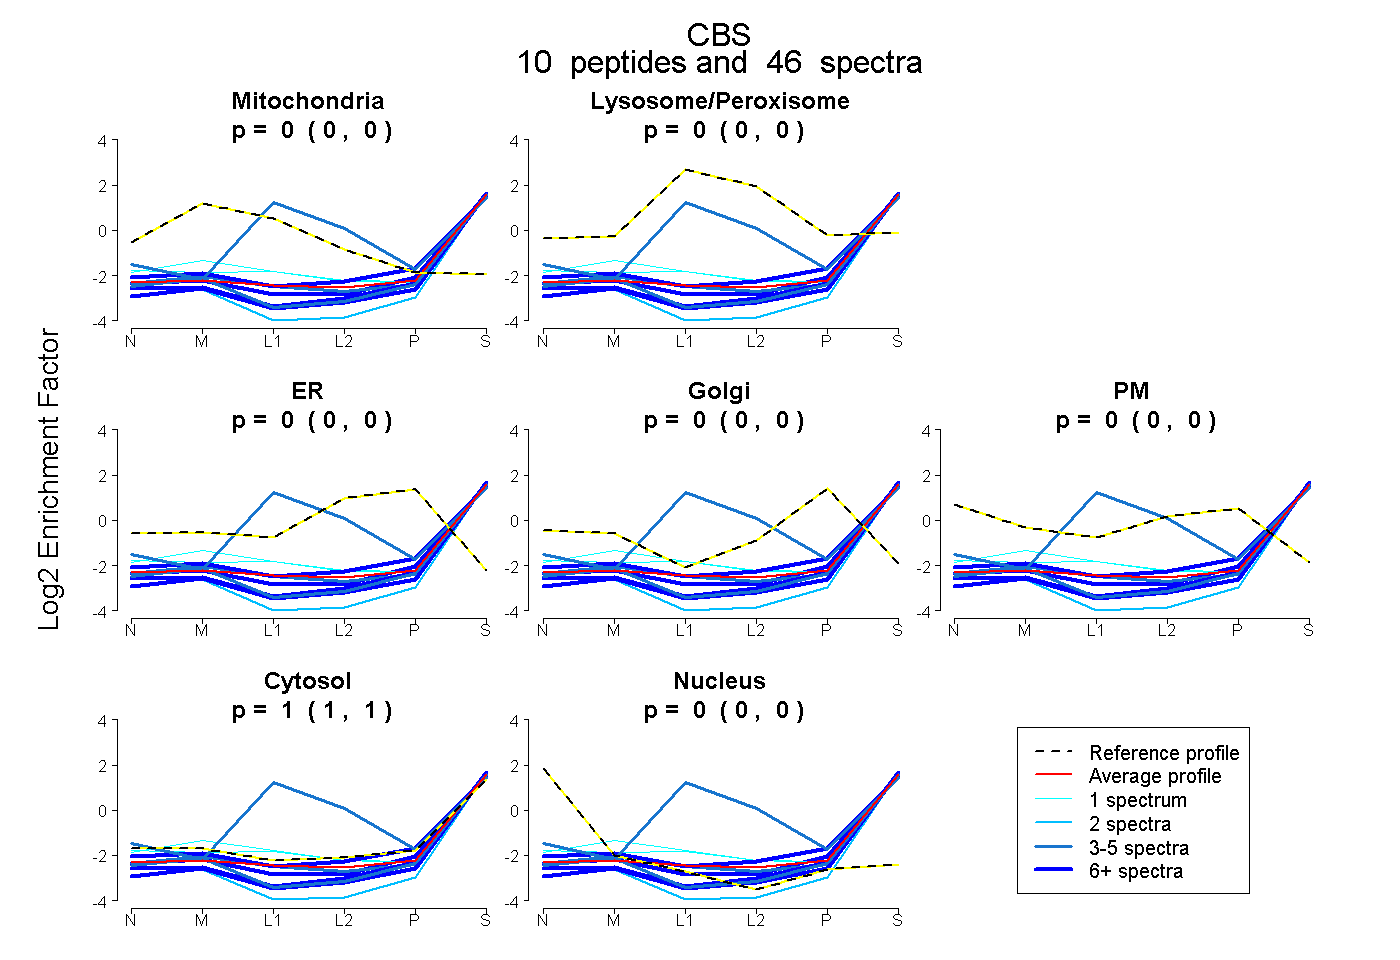
0.000 | 0.000
0.000 | 0.000
0.000 | 0.000
0.000 | 0.000
0.000 | 0.000
1.000 | 1.000
0.000 | 0.000