 14
14peptides
spectra
0.000 | 0.000
0.200 | 0.260
0.000 | 0.000
0.000 | 0.000
0.000 | 0.000
0.541 | 0.602
0.114 | 0.167
0.027 | 0.068
| Plot | Mito | Lyso | Perox | ER | Golgi | PM | Cytosol | Nucleus | |||||
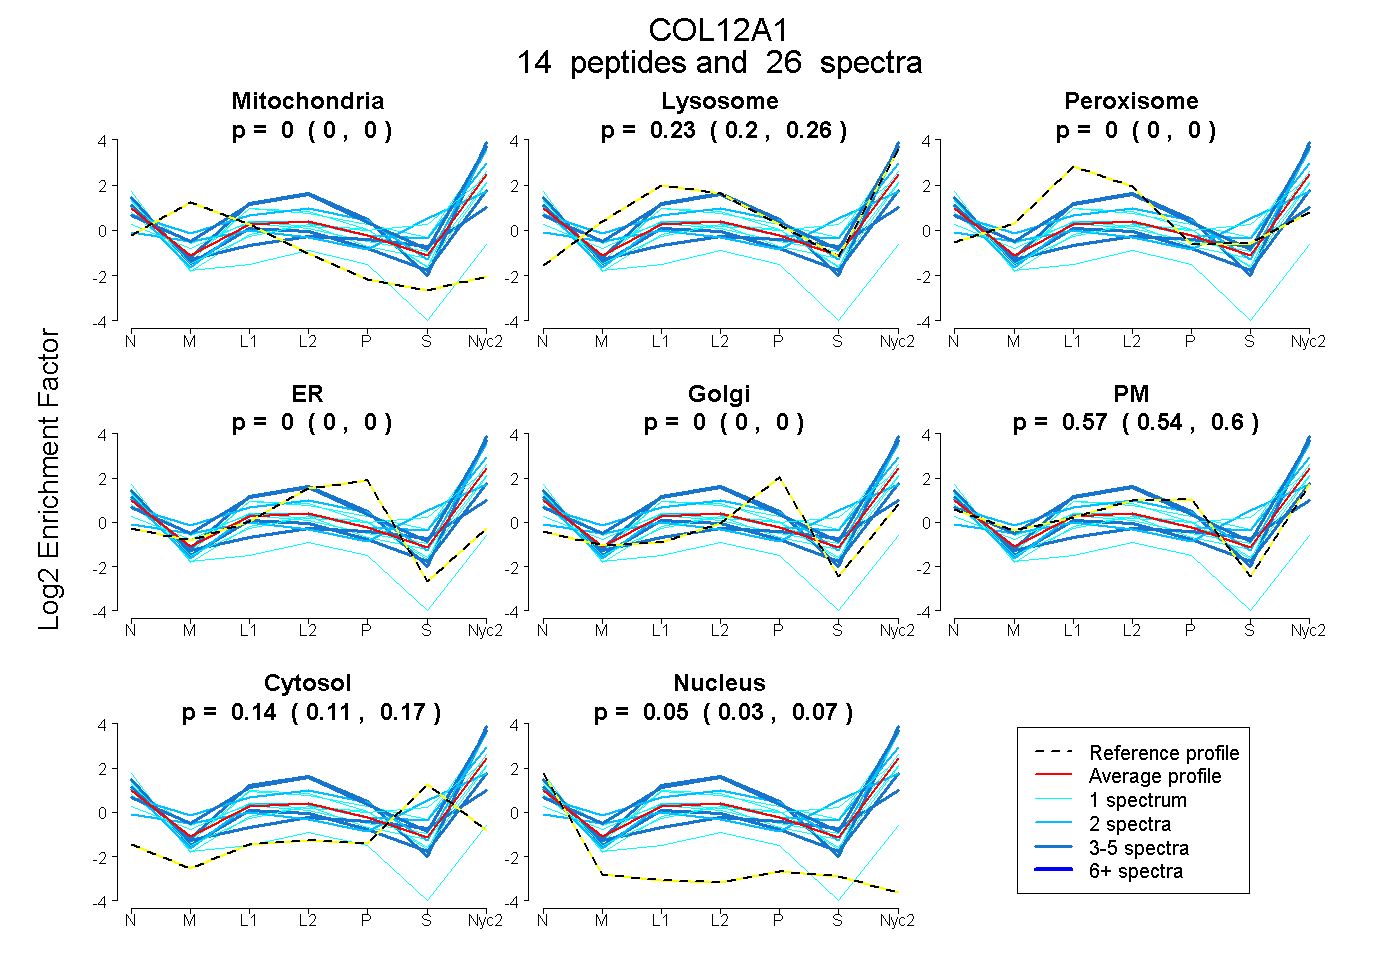
| Expt A |
14 peptides |
26 spectra |
|
0.000 0.000 | 0.000 |
0.233 0.200 | 0.260 |
0.000 0.000 | 0.000 |
0.000 0.000 | 0.000 |
0.000 0.000 | 0.000 |
0.574 0.541 | 0.602 |
0.144 0.114 | 0.167 |
0.049 0.027 | 0.068 |
| 3 spectra, LSPADGTR | 0.000 | 0.295 | 0.000 | 0.000 | 0.000 | 0.437 | 0.000 | 0.268 | ||
| 1 spectrum, IEQELAAIK | 0.000 | 0.144 | 0.000 | 0.000 | 0.000 | 0.577 | 0.159 | 0.120 | ||
| 1 spectrum, EVSTPANQR | 0.000 | 0.328 | 0.000 | 0.000 | 0.000 | 0.655 | 0.000 | 0.017 | ||
| 1 spectrum, AINNFPYR | 0.000 | 0.409 | 0.000 | 0.000 | 0.000 | 0.383 | 0.077 | 0.131 | ||
| 4 spectra, ILLTPMAAGSR | 0.000 | 0.391 | 0.000 | 0.000 | 0.000 | 0.609 | 0.000 | 0.000 | ||
| 1 spectrum, TKPLNTVR | 0.000 | 0.000 | 0.000 | 0.000 | 0.000 | 0.807 | 0.143 | 0.050 | ||
| 2 spectra, SQDEVEIPAR | 0.000 | 0.273 | 0.000 | 0.000 | 0.000 | 0.475 | 0.251 | 0.000 | ||
| 2 spectra, SFEISPNR | 0.000 | 0.421 | 0.009 | 0.000 | 0.000 | 0.091 | 0.446 | 0.033 | ||
| 1 spectrum, GDTTTTVLR | 0.000 | 0.461 | 0.000 | 0.000 | 0.000 | 0.394 | 0.146 | 0.000 | ||
| 3 spectra, NADEVELK | 0.000 | 0.000 | 0.000 | 0.000 | 0.000 | 0.595 | 0.312 | 0.093 | ||
| 1 spectrum, VVYRPQGGGR | 0.000 | 0.395 | 0.000 | 0.000 | 0.000 | 0.283 | 0.321 | 0.000 | ||
| 3 spectra, VDEETEHTMR | 0.000 | 0.560 | 0.000 | 0.000 | 0.000 | 0.440 | 0.000 | 0.000 | ||
| 2 spectra, NTFTESAGSR | 0.000 | 0.434 | 0.000 | 0.000 | 0.000 | 0.566 | 0.000 | 0.000 | ||
| 1 spectrum, GPPGPPGRPGNSGIR | 0.000 | 0.000 | 0.000 | 0.000 | 0.000 | 0.477 | 0.000 | 0.523 |
| Plot | Mito | Lyso or Perox | ER | Golgi | PM | Cytosol | Nucleus | ||||||
| Expt B |
1 peptide |
1 spectrum |
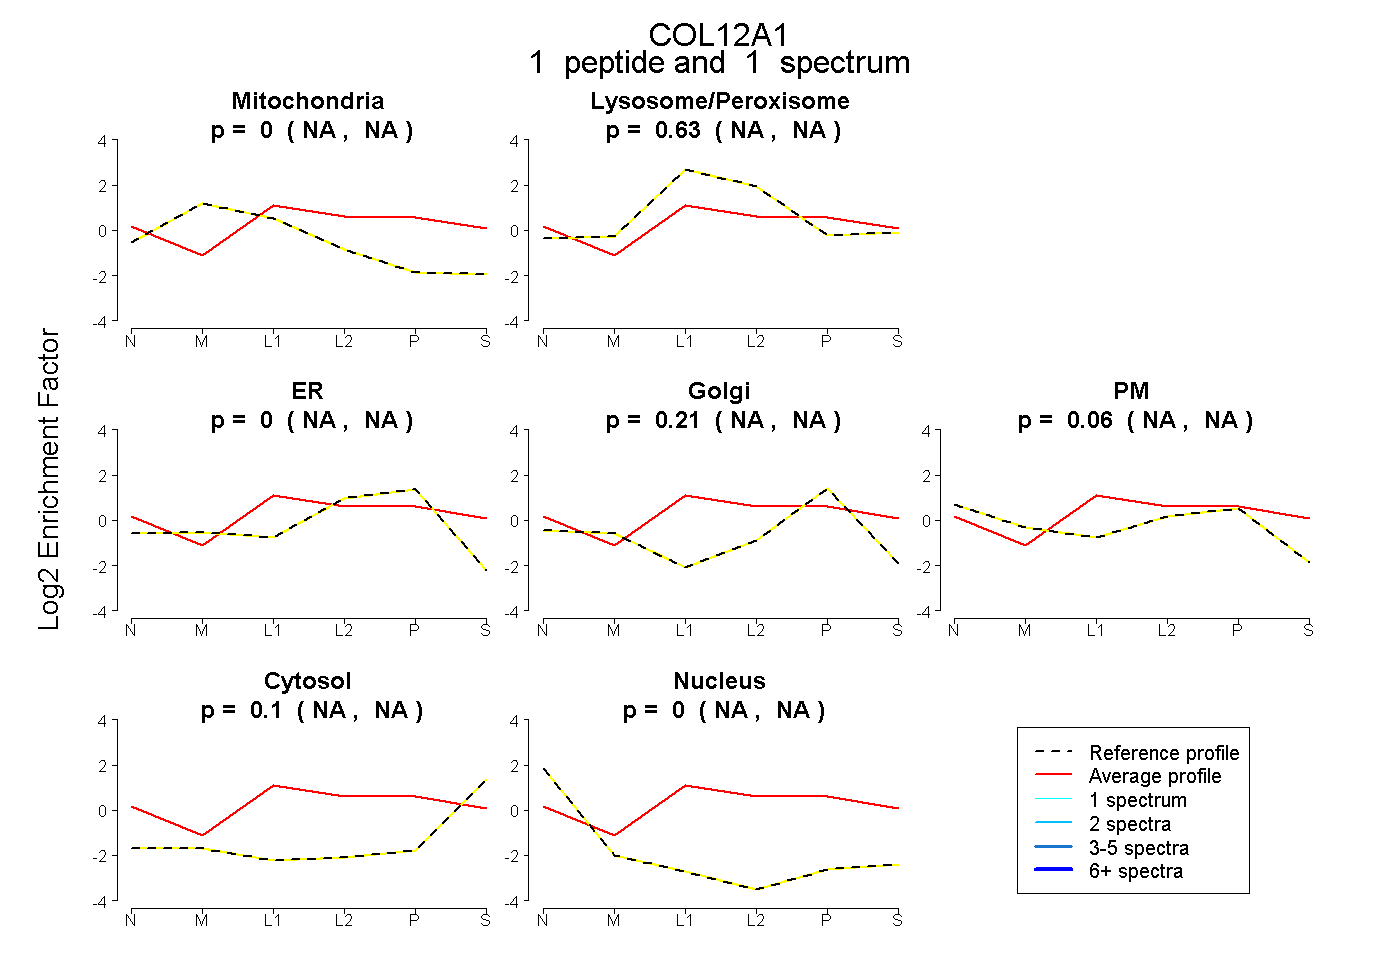 |
0.000 NA | NA |
0.627 NA | NA |
0.000 NA | NA |
0.211 NA | NA |
0.058 NA | NA |
0.100 NA | NA |
0.005 NA | NA |
|||
| Plot | Lyso | Other | |||||||||||
| Expt C |
14 peptides |
25 spectra |
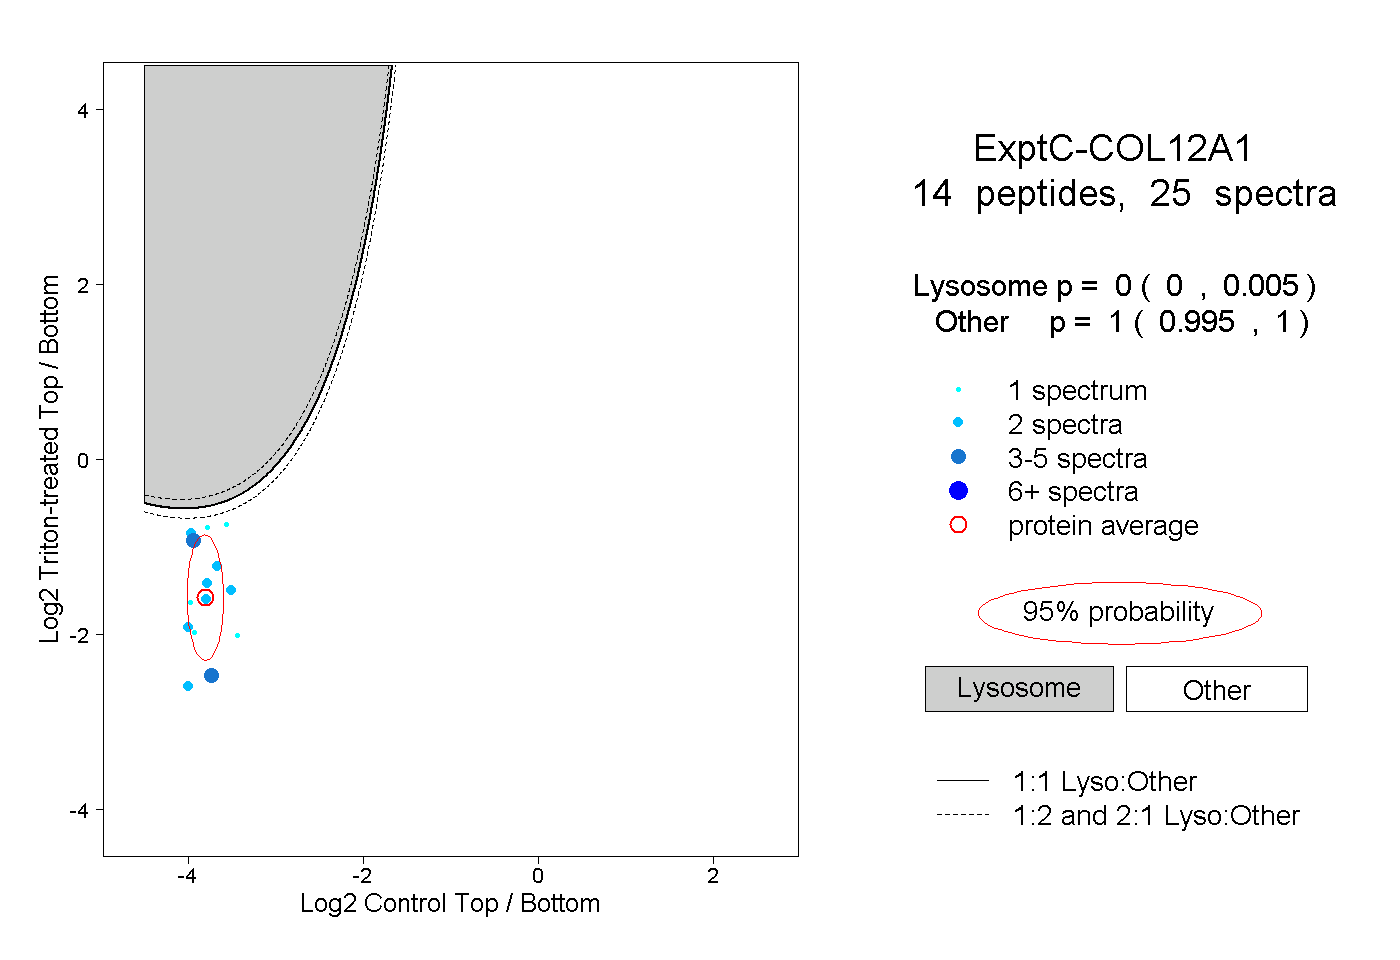 |
0.000 0.000 | 0.005 |
1.000 0.995 | 1.000 |
||||||||
| Plot | Lyso | Other | |||||||||||
| Expt D |
3 peptides |
12 spectra |
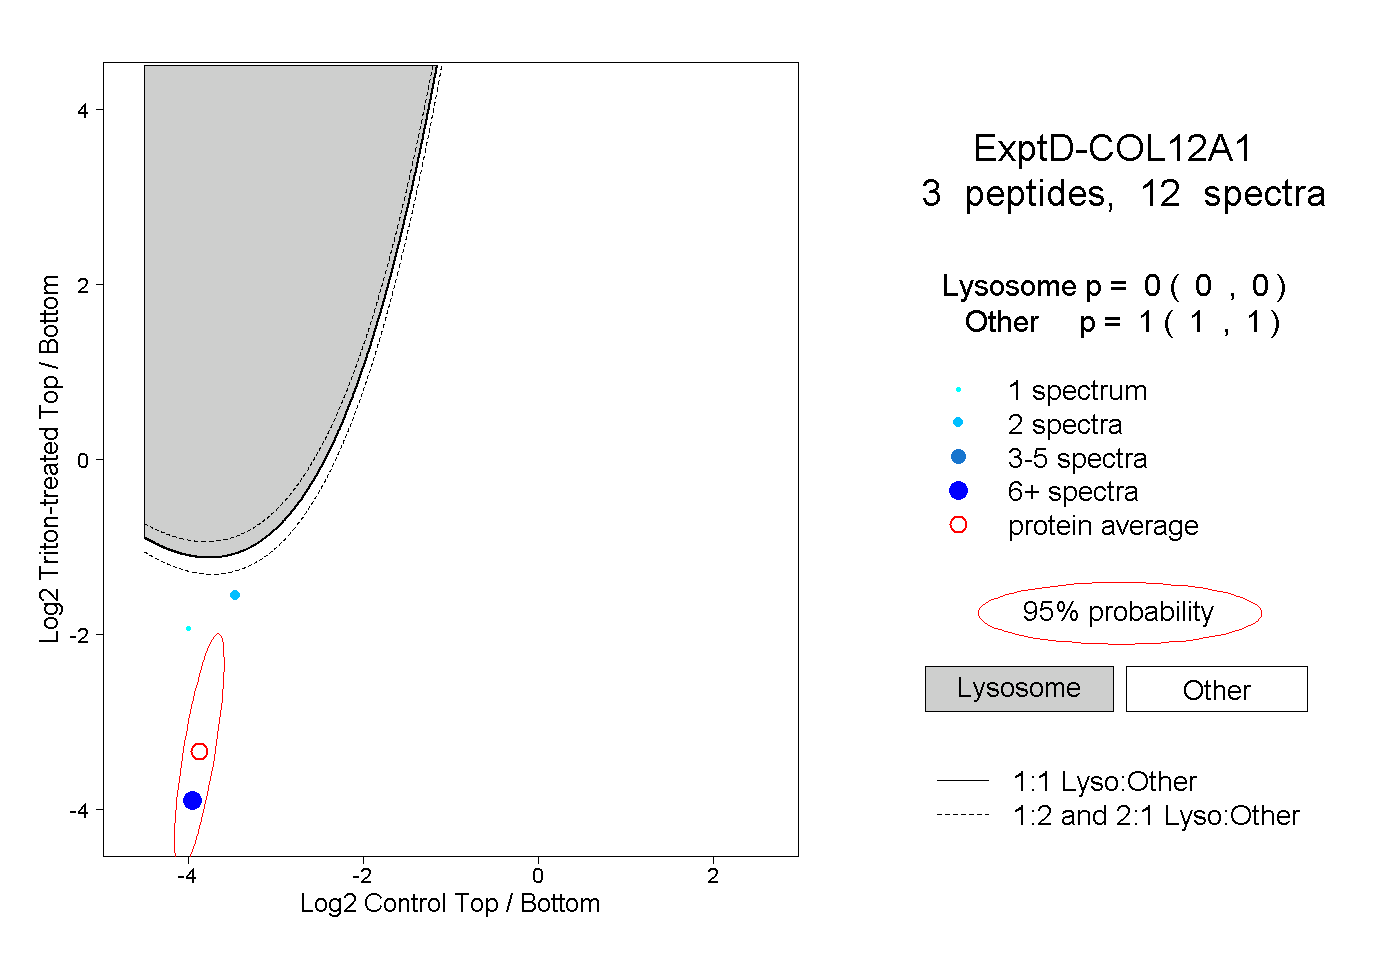 |
0.000 0.000 | 0.000 |
1.000 1.000 | 1.000 |