6
6peptides
spectra
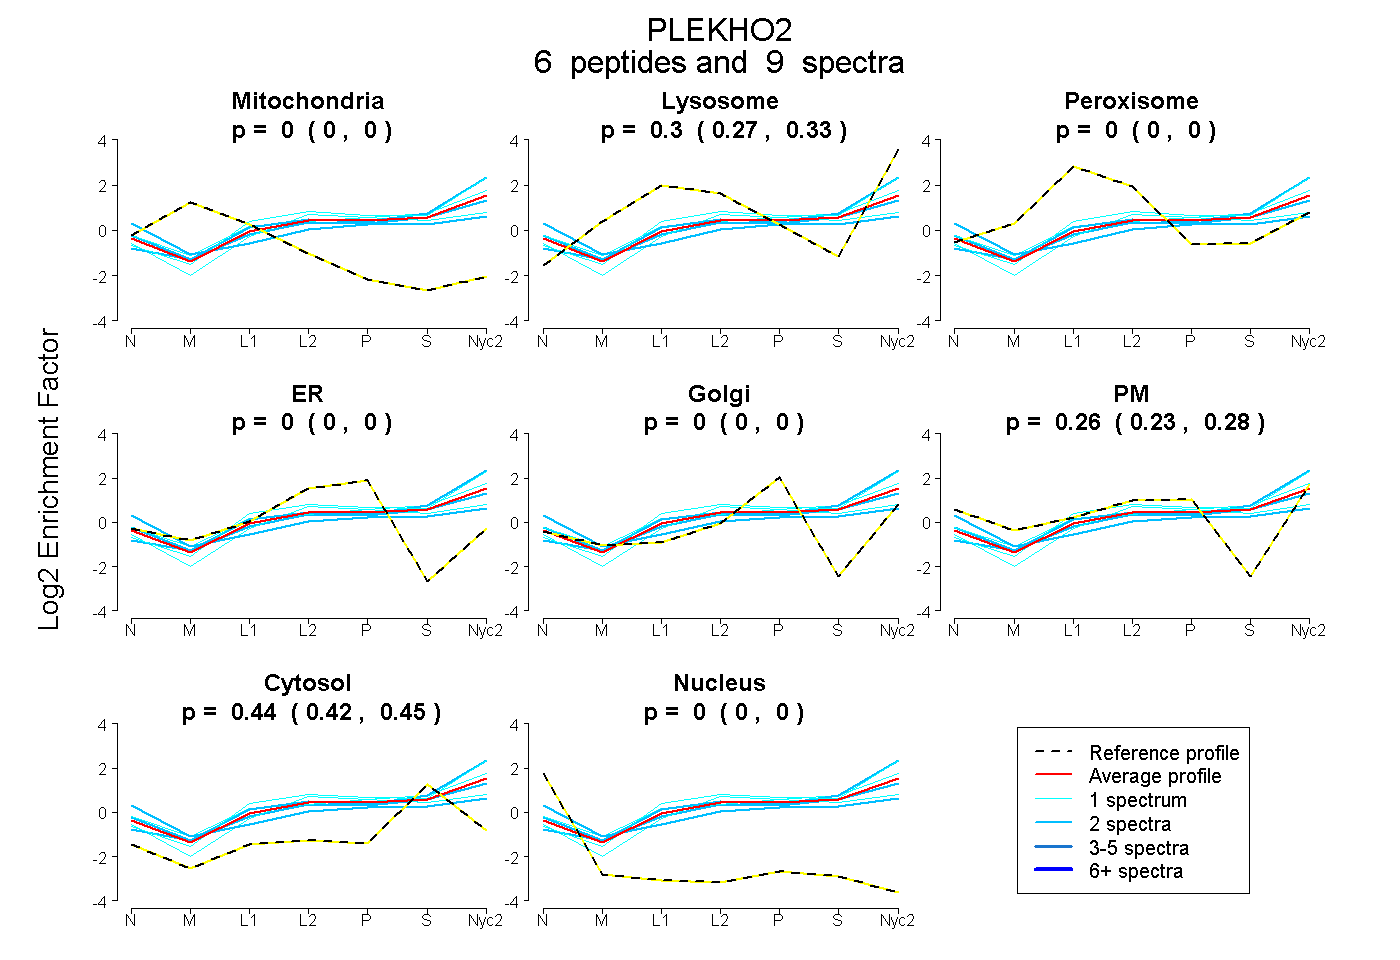
0.000 | 0.000
0.268 | 0.330
0.000 | 0.000
0.000 | 0.000
0.000 | 0.000
0.230 | 0.281
0.424 | 0.452
0.000 | 0.000
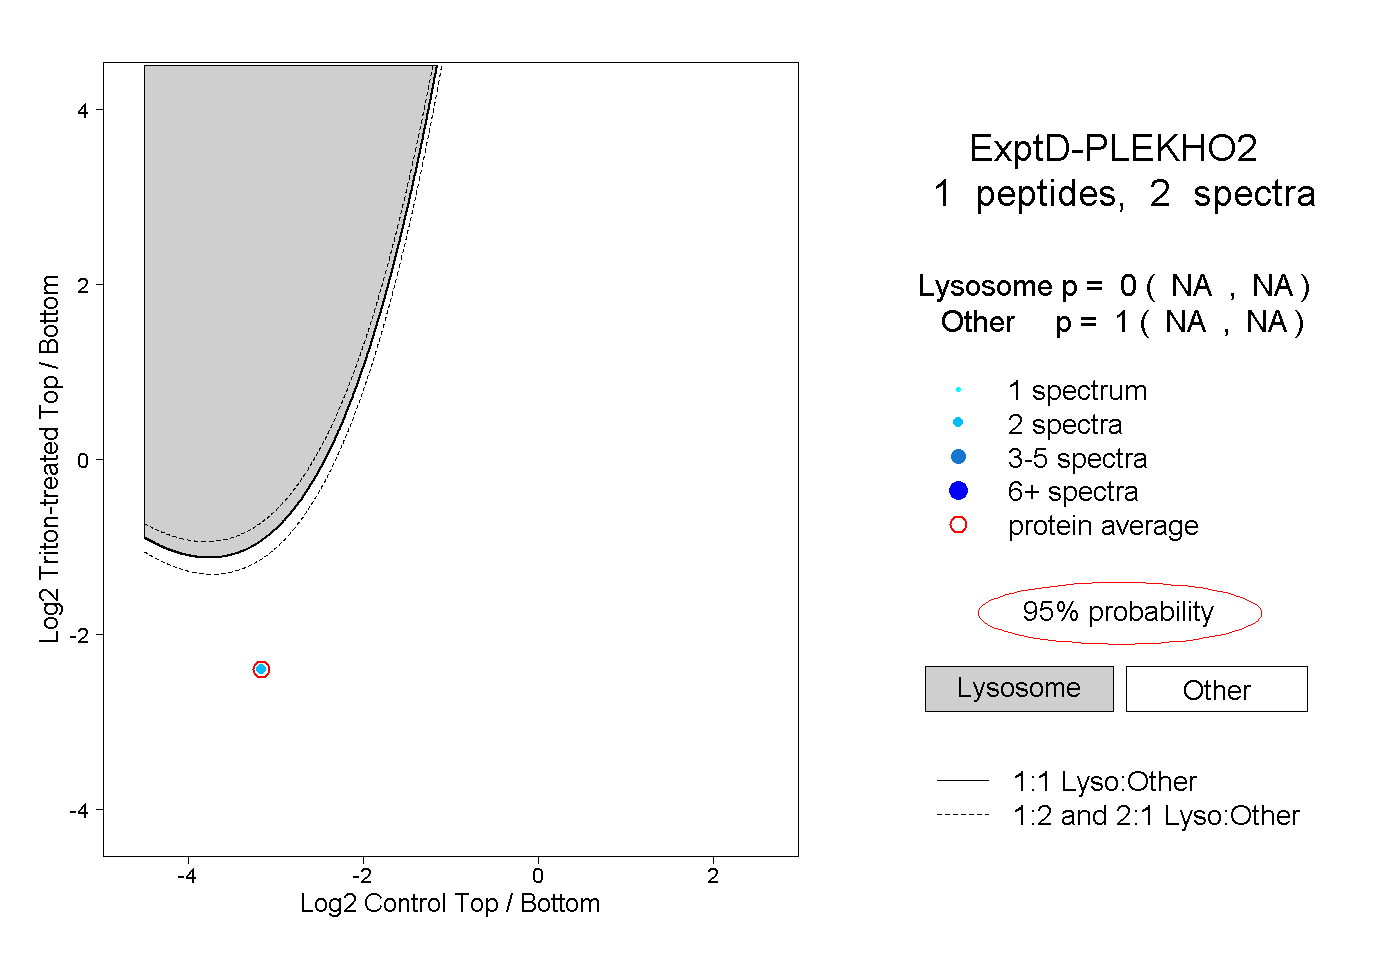
1peptide
spectrum
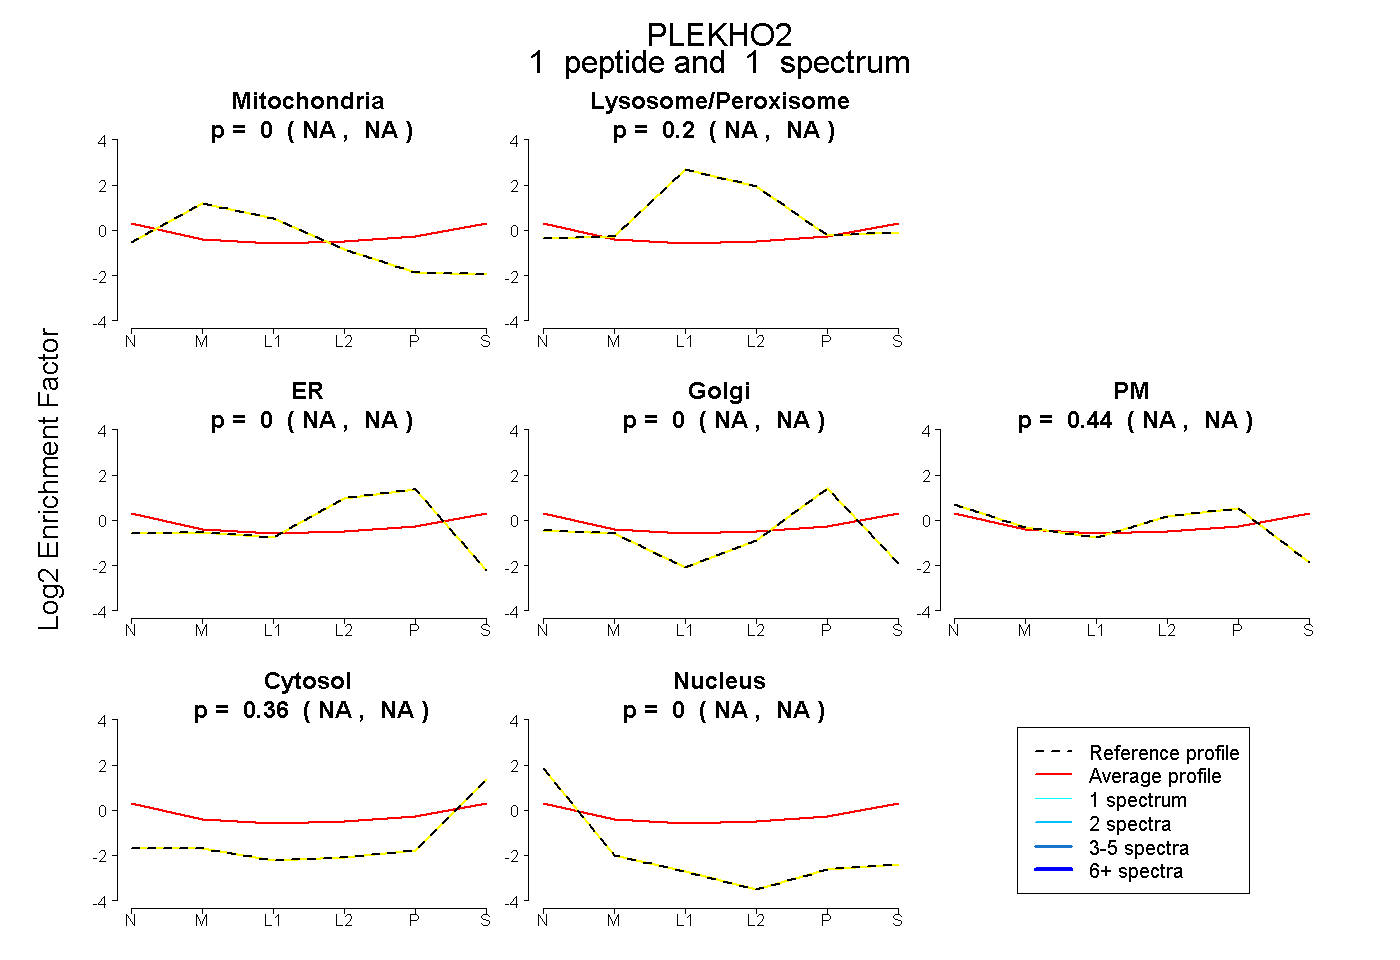
NA | NA
NA | NA
NA | NA
NA | NA
NA | NA
NA | NA
NA | NA
8peptides
spectra
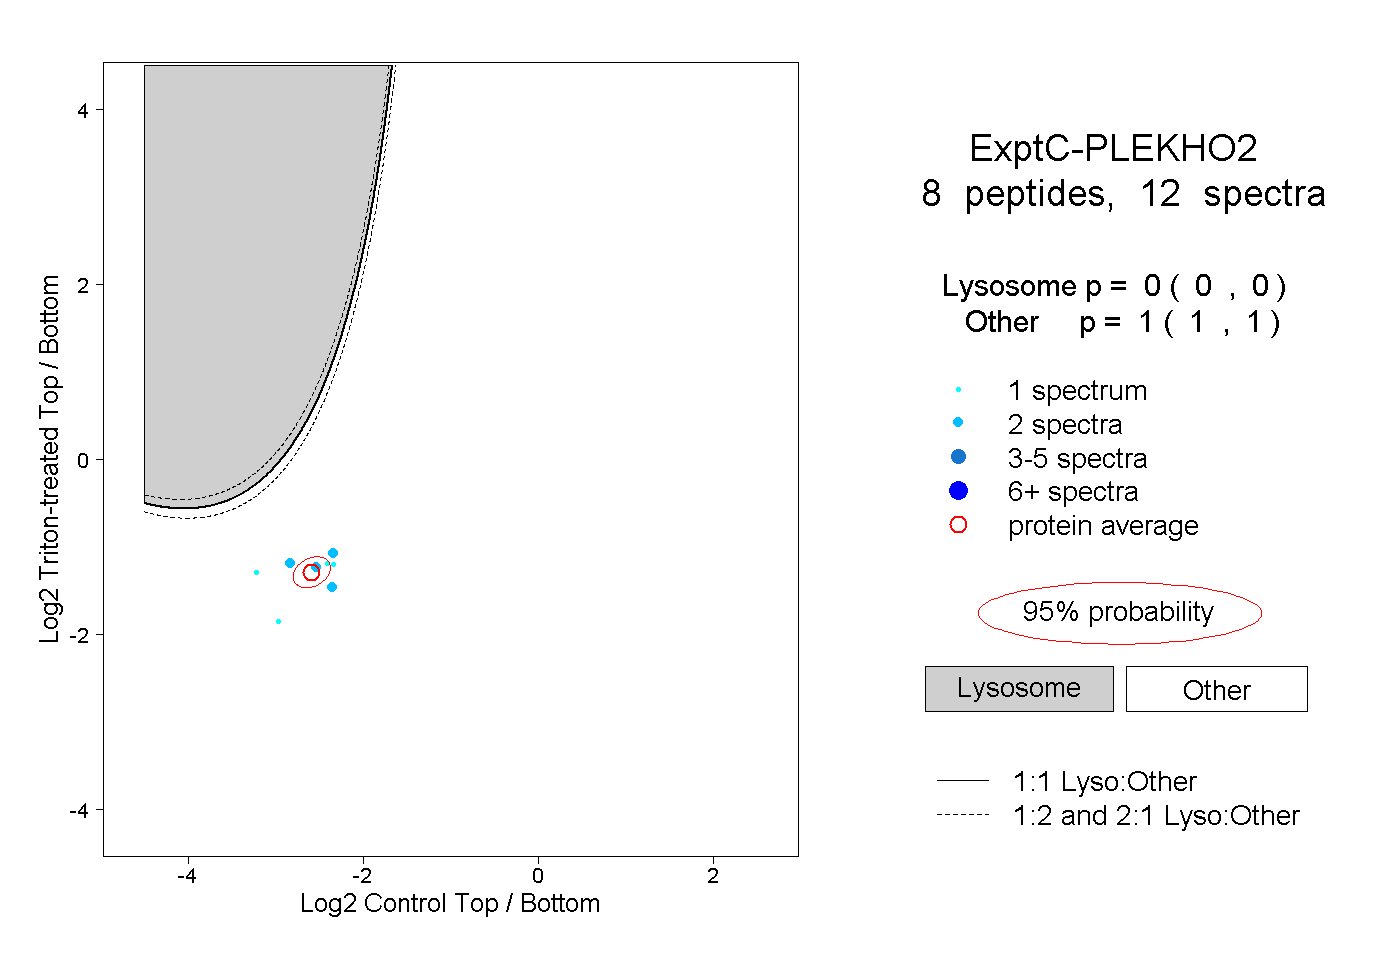
0.000 | 0.000
1.000 | 1.000