 6
6peptides
spectra
0.000 | 0.000
0.268 | 0.330
0.000 | 0.000
0.000 | 0.000
0.000 | 0.000
0.230 | 0.281
0.424 | 0.452
0.000 | 0.000
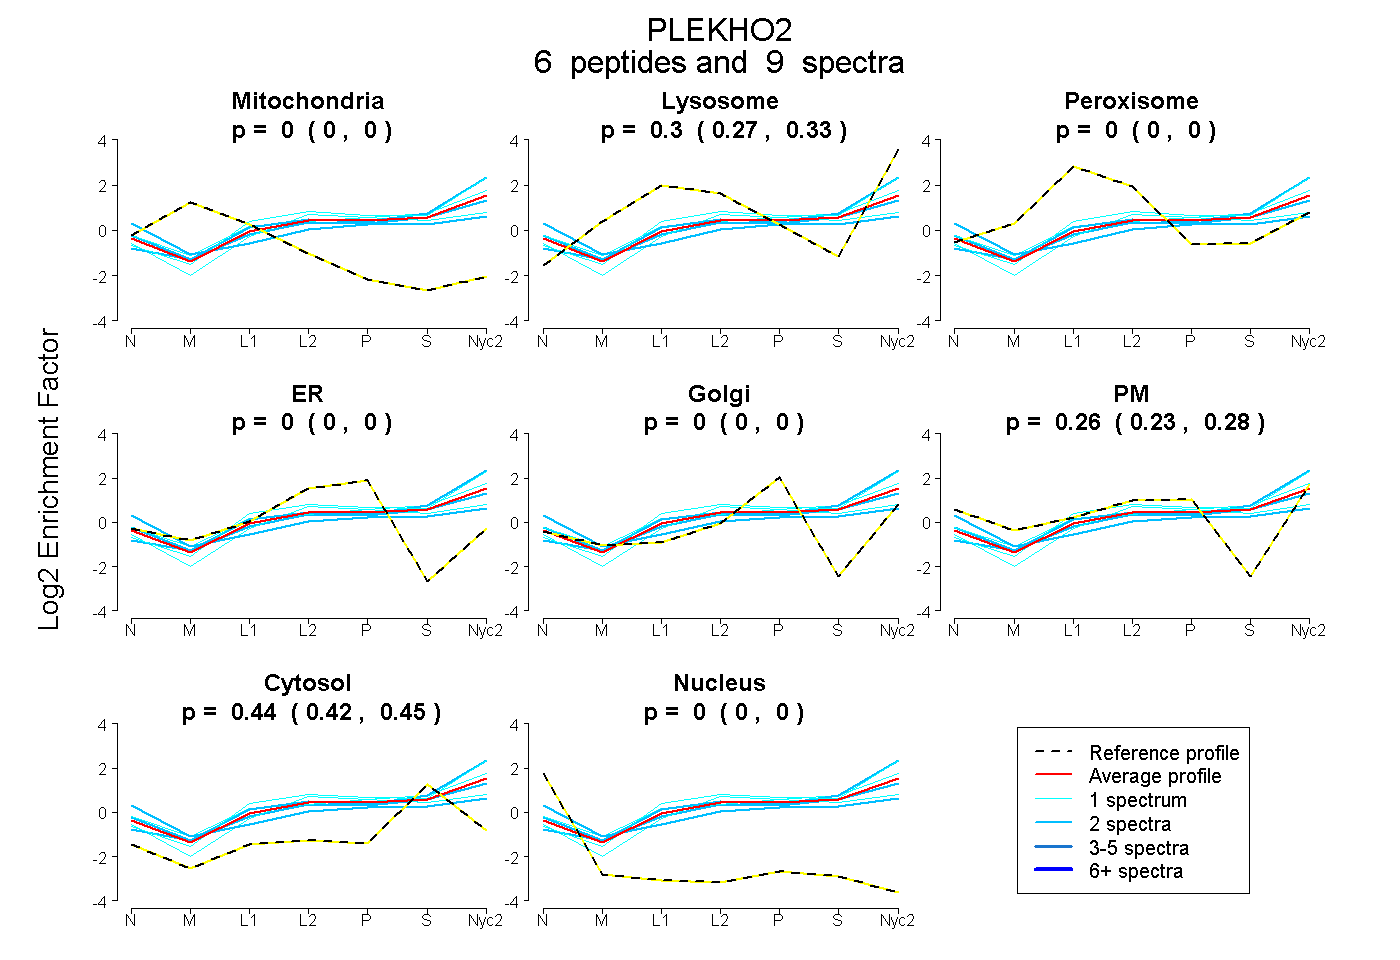
| Plot | Mito | Lyso | Perox | ER | Golgi | PM | Cytosol | Nucleus | |||||
| Expt A |
6 peptides |
9 spectra |
|
0.000 0.000 | 0.000 |
0.304 0.268 | 0.330 |
0.000 0.000 | 0.000 |
0.000 0.000 | 0.000 |
0.000 0.000 | 0.000 |
0.257 0.230 | 0.281 |
0.439 0.424 | 0.452 |
0.000 0.000 | 0.000 |
| 2 spectra, VSWENPSPEEPSVSER | 0.000 | 0.000 | 0.046 | 0.000 | 0.000 | 0.489 | 0.466 | 0.000 | ||
| 2 spectra, AFDEVK | 0.000 | 0.252 | 0.000 | 0.000 | 0.000 | 0.289 | 0.459 | 0.000 | ||
| 1 spectrum, SSGGLLSLWK | 0.000 | 0.518 | 0.000 | 0.000 | 0.028 | 0.090 | 0.365 | 0.000 | ||
| 2 spectra, EVASAASDGLSR | 0.000 | 0.530 | 0.000 | 0.000 | 0.022 | 0.033 | 0.414 | 0.000 | ||
| 1 spectrum, EDSDFK | 0.000 | 0.339 | 0.000 | 0.000 | 0.047 | 0.154 | 0.461 | 0.000 | ||
| 1 spectrum, CVETVELGSYEK | 0.000 | 0.098 | 0.195 | 0.000 | 0.096 | 0.226 | 0.385 | 0.000 |
| Plot | Mito | Lyso or Perox | ER | Golgi | PM | Cytosol | Nucleus | ||||||
| Expt B |
1 peptide |
1 spectrum |
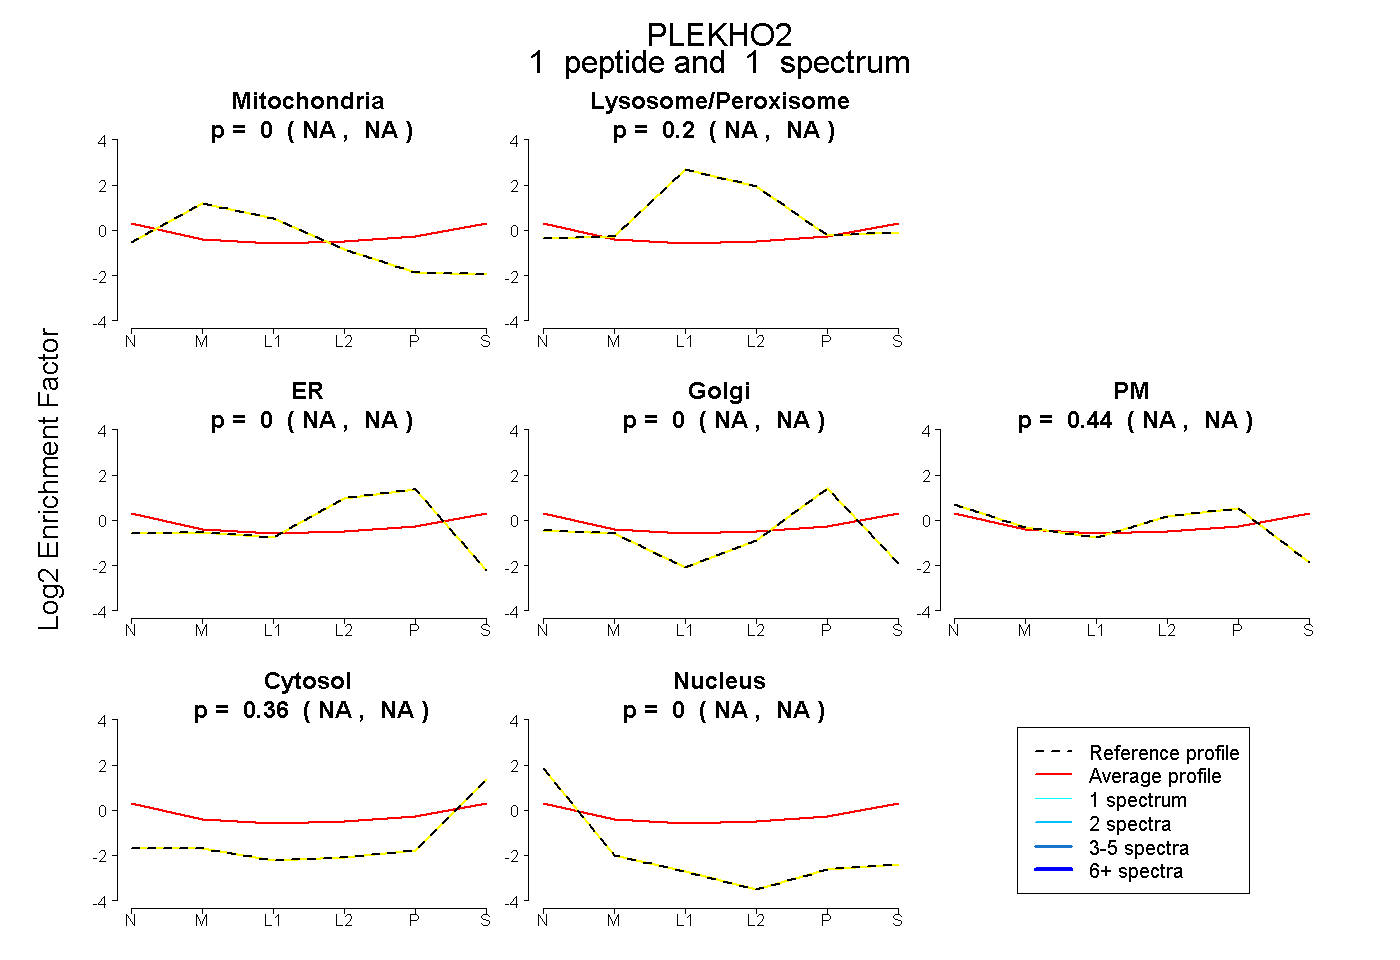 |
0.000 NA | NA |
0.200 NA | NA |
0.000 NA | NA |
0.000 NA | NA |
0.441 NA | NA |
0.359 NA | NA |
0.000 NA | NA |
|||
| Plot | Lyso | Other | |||||||||||
| Expt C |
8 peptides |
12 spectra |
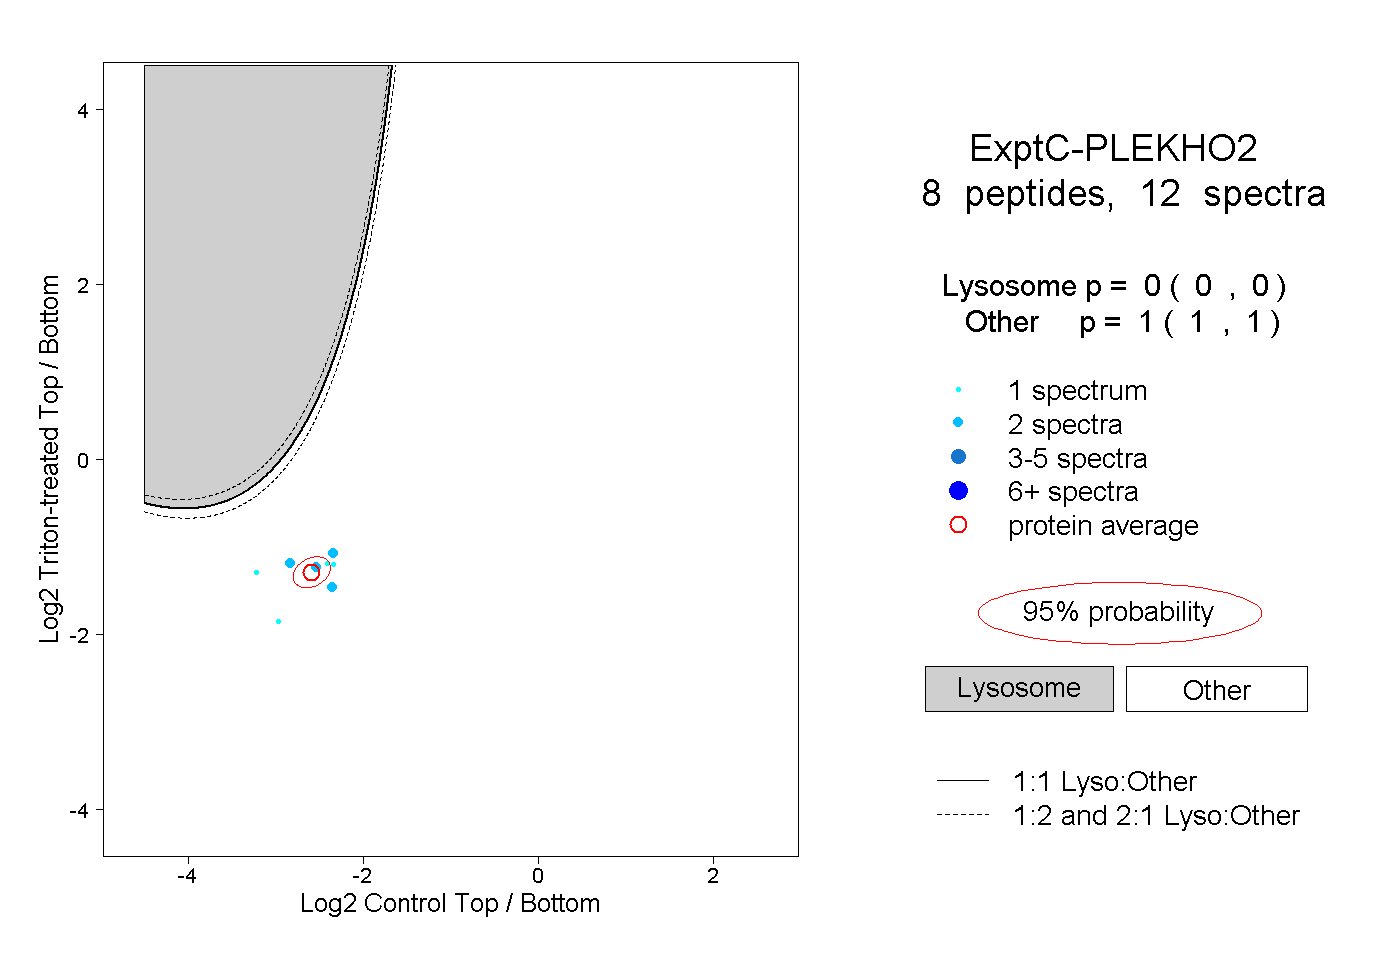 |
0.000 0.000 | 0.000 |
1.000 1.000 | 1.000 |
||||||||
| Plot | Lyso | Other | |||||||||||
| Expt D |
1 peptide |
2 spectra |
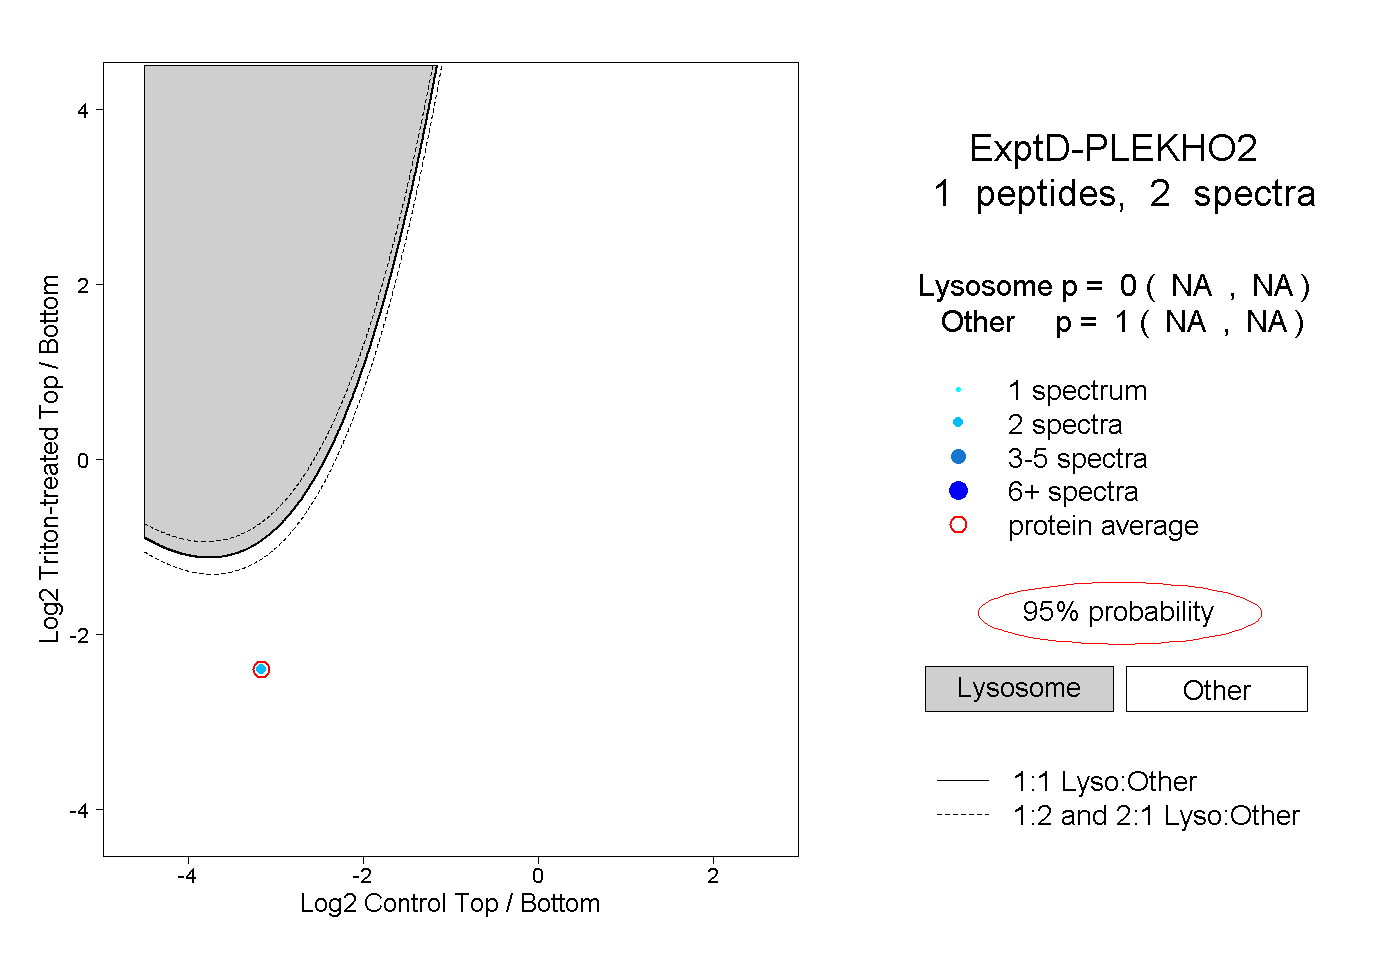 |
0.000 NA | NA |
1.000 NA | NA |