 2
2peptides
spectra
0.000 | 0.000
0.000 | 0.000
0.000 | 0.000
0.000 | 0.117
0.000 | 0.118
0.000 | 0.000
0.521 | 0.573
0.310 | 0.384
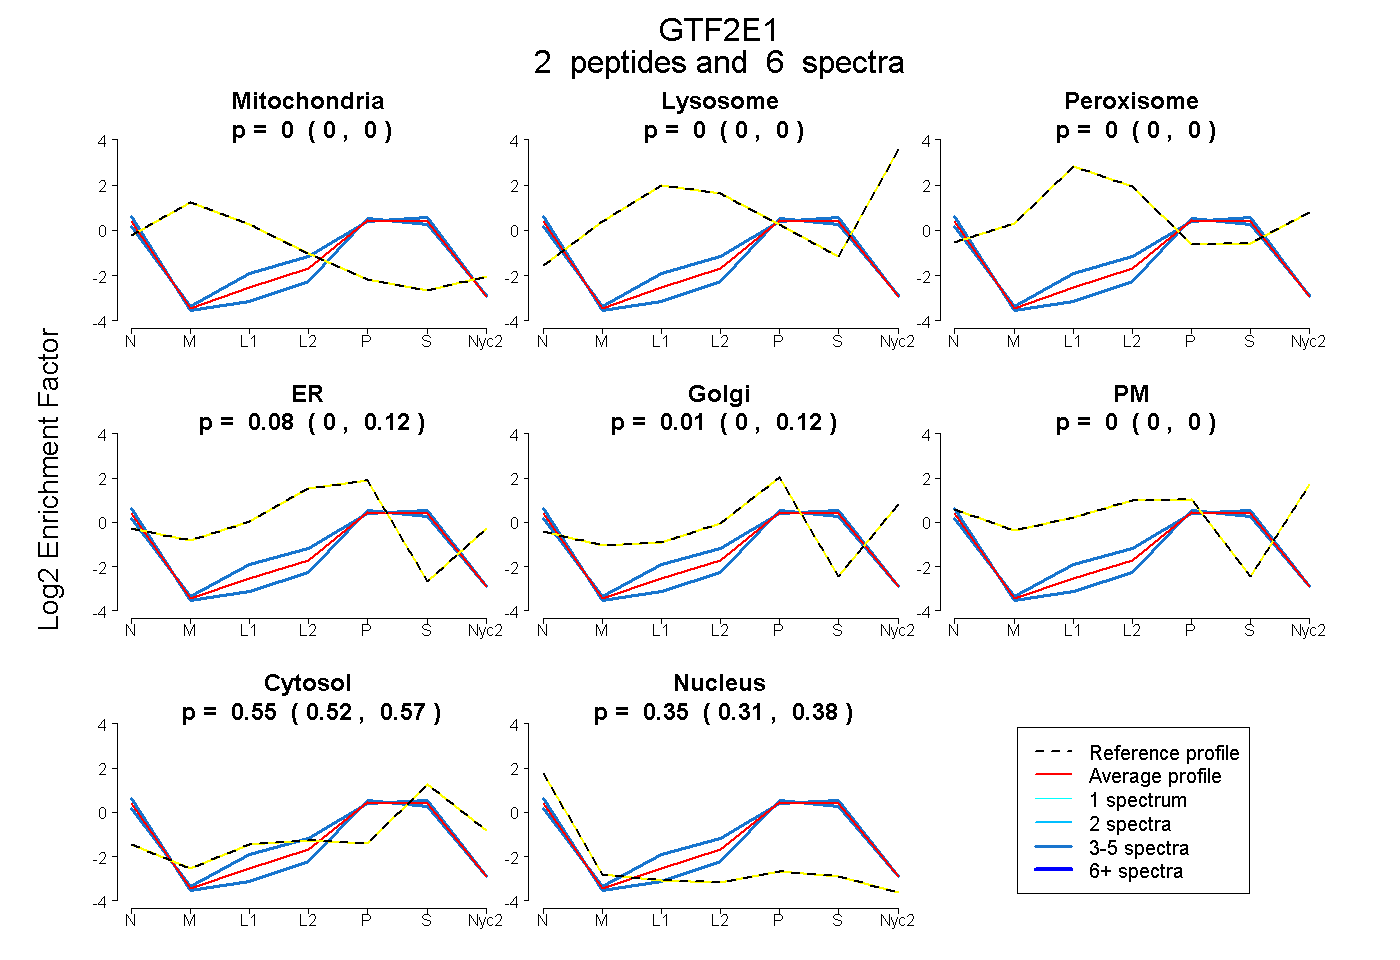
| Plot | Mito | Lyso | Perox | ER | Golgi | PM | Cytosol | Nucleus | |||||
| Expt A |
2 peptides |
6 spectra |
|
0.000 0.000 | 0.000 |
0.000 0.000 | 0.000 |
0.000 0.000 | 0.000 |
0.083 0.000 | 0.117 |
0.013 0.000 | 0.118 |
0.000 0.000 | 0.000 |
0.555 0.521 | 0.573 |
0.349 0.310 | 0.384 |
| 3 spectra, ERPIWLR | 0.000 | 0.000 | 0.000 | 0.000 | 0.081 | 0.000 | 0.493 | 0.426 | ||
| 3 spectra, EEDMLELLK | 0.000 | 0.000 | 0.000 | 0.145 | 0.000 | 0.000 | 0.587 | 0.268 |