5
5peptides
spectra
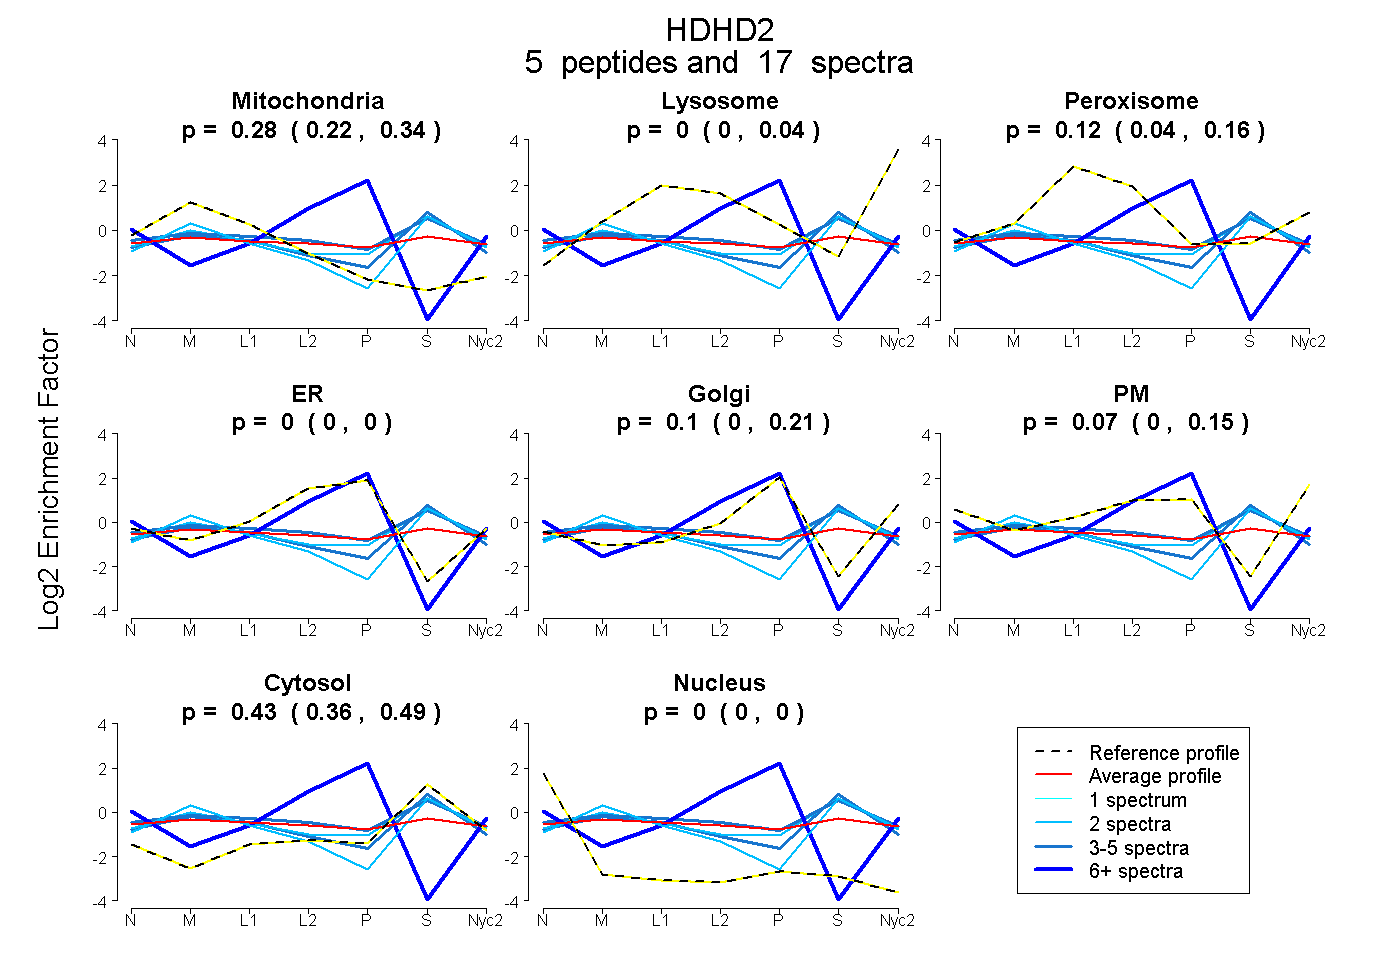
0.224 | 0.337
0.000 | 0.041
0.037 | 0.162
0.000 | 0.000
0.000 | 0.211
0.000 | 0.150
0.362 | 0.485
0.000 | 0.000
4peptides
spectra
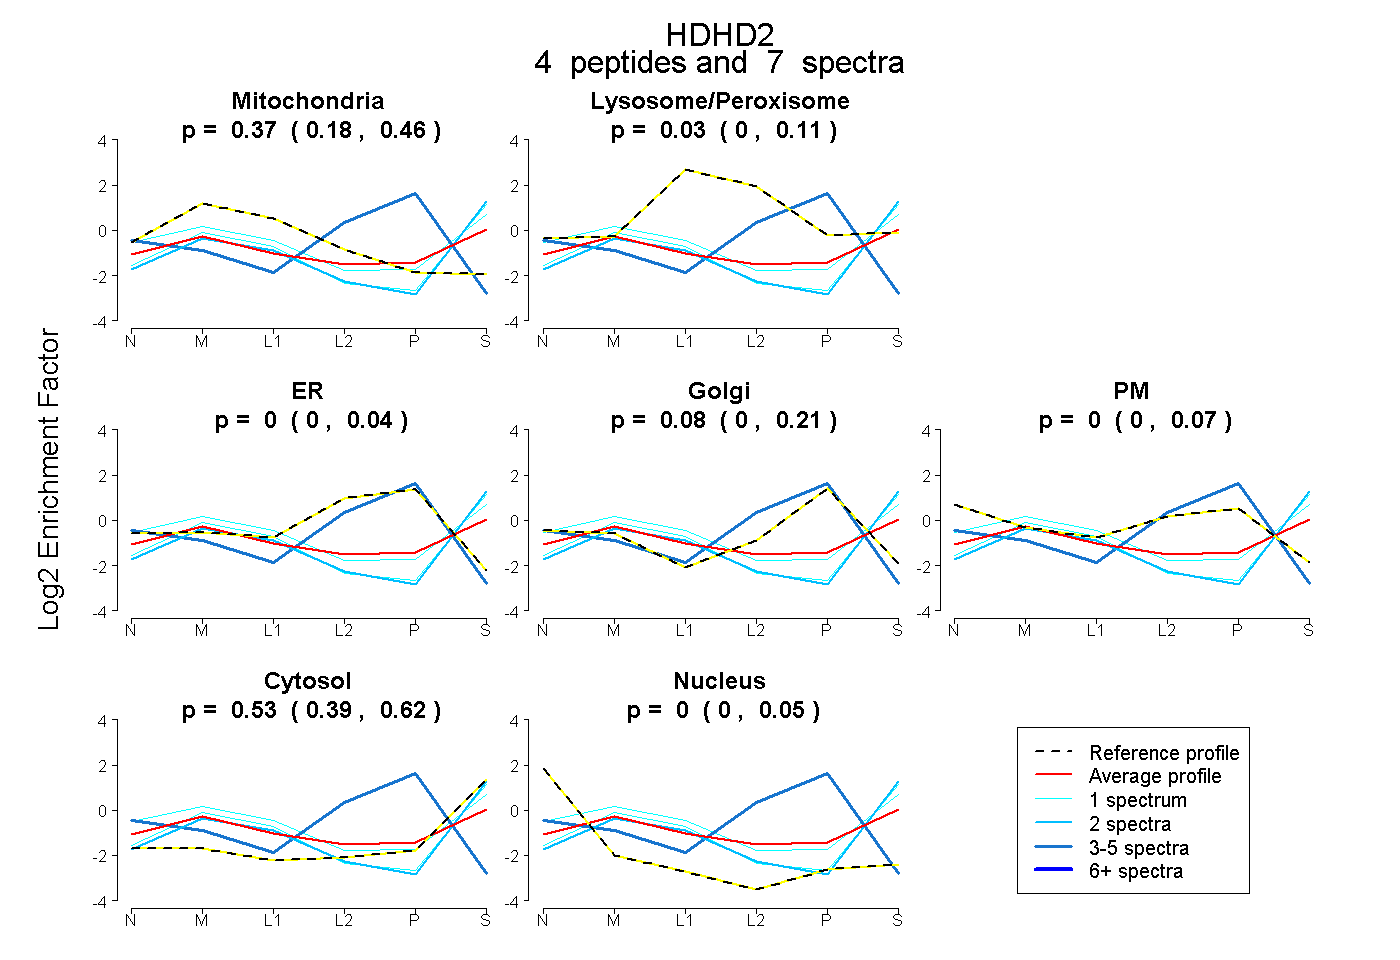
0.180 | 0.455
0.000 | 0.112
0.000 | 0.038
0.000 | 0.207
0.000 | 0.066
0.386 | 0.621
0.000 | 0.050