 5
5peptides
spectra
0.224 | 0.337
0.000 | 0.041
0.037 | 0.162
0.000 | 0.000
0.000 | 0.211
0.000 | 0.150
0.362 | 0.485
0.000 | 0.000
| Plot | Mito | Lyso | Perox | ER | Golgi | PM | Cytosol | Nucleus | |||||
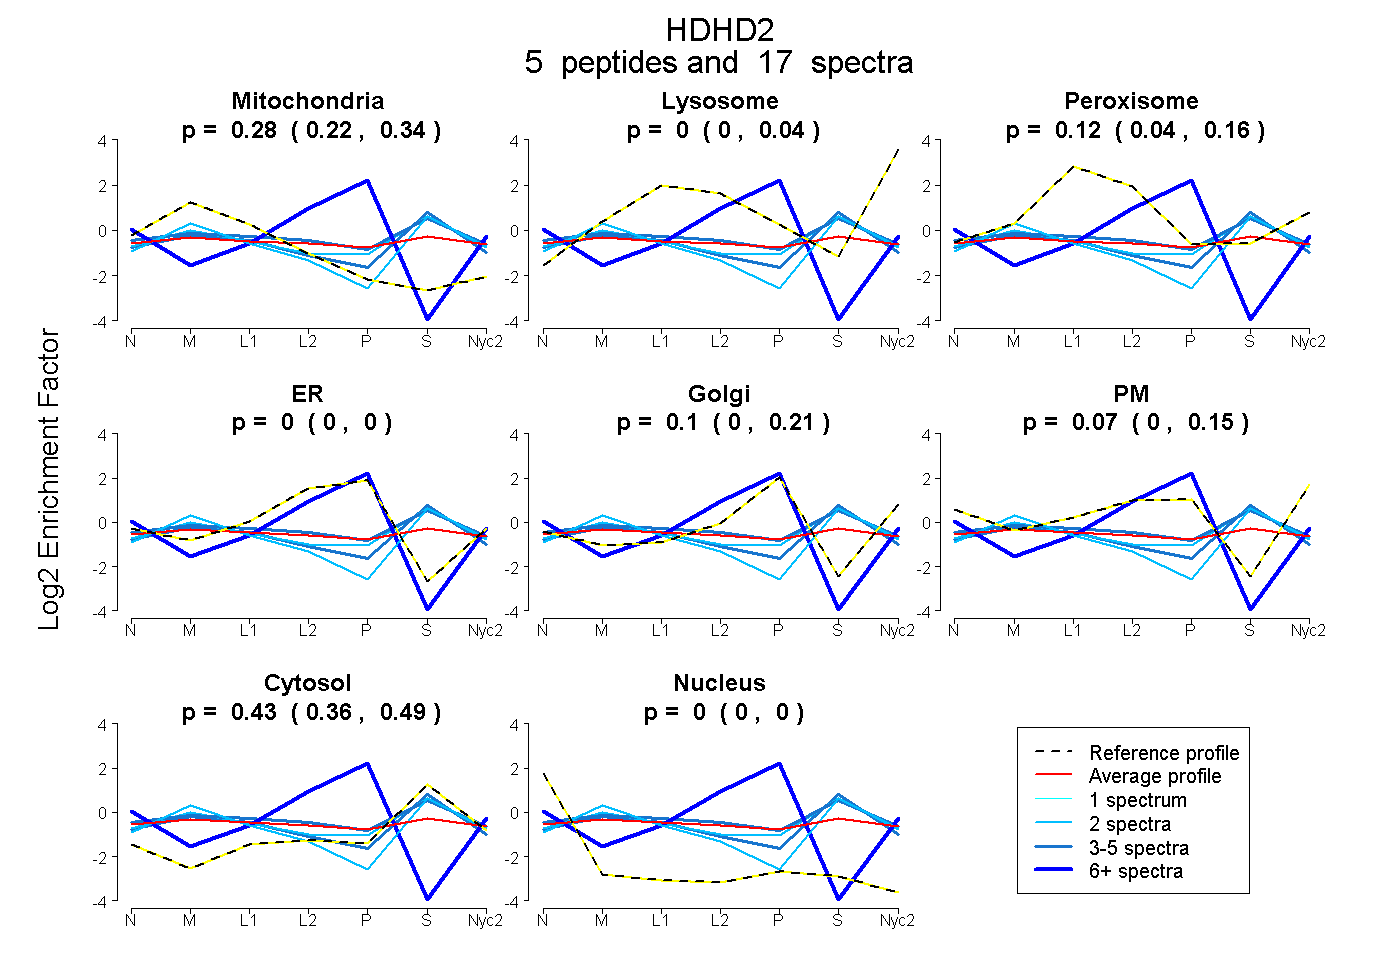
| Expt A |
5 peptides |
17 spectra |
|
0.280 0.224 | 0.337 |
0.000 0.000 | 0.041 |
0.121 0.037 | 0.162 |
0.000 0.000 | 0.000 |
0.098 0.000 | 0.211 |
0.073 0.000 | 0.150 |
0.428 0.362 | 0.485 |
0.000 0.000 | 0.000 |
| 2 spectra, NLIEQR | 0.293 | 0.055 | 0.107 | 0.000 | 0.000 | 0.000 | 0.545 | 0.000 | ||
| 2 spectra, TFFLEALR | 0.418 | 0.032 | 0.018 | 0.000 | 0.000 | 0.000 | 0.532 | 0.000 | ||
| 4 spectra, AASVMVR | 0.295 | 0.000 | 0.120 | 0.000 | 0.000 | 0.000 | 0.585 | 0.000 | ||
| 6 spectra, SQLLNLIR | 0.000 | 0.000 | 0.000 | 0.716 | 0.223 | 0.000 | 0.000 | 0.061 | ||
| 3 spectra, QVRPMLLVDDR | 0.212 | 0.000 | 0.234 | 0.000 | 0.000 | 0.054 | 0.500 | 0.000 |
| Plot | Mito | Lyso or Perox | ER | Golgi | PM | Cytosol | Nucleus | ||||||
| Expt B |
4 peptides |
7 spectra |
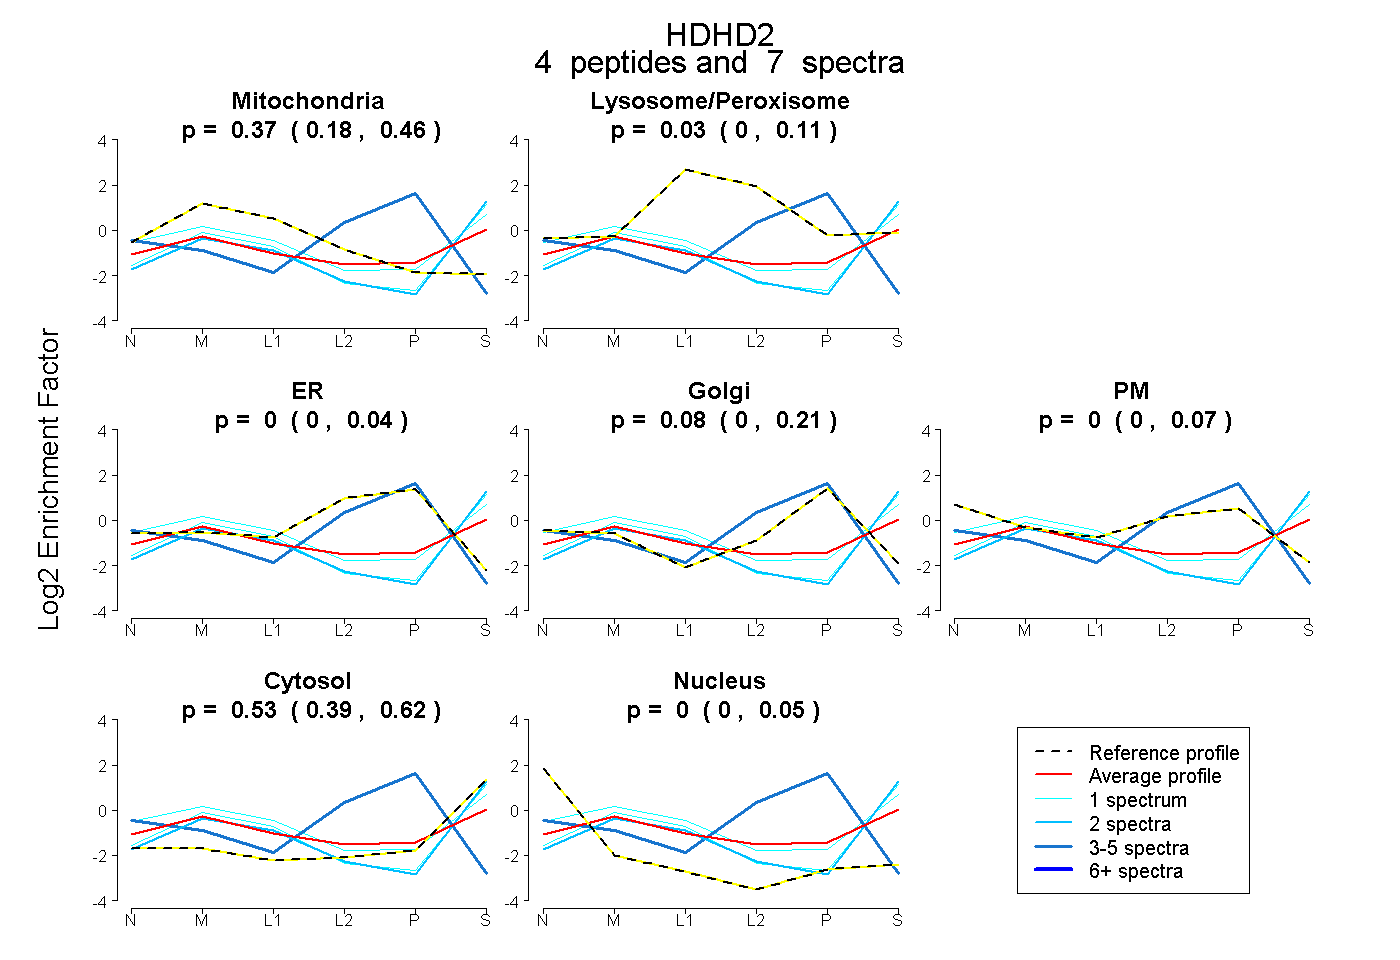 |
0.371 0.180 | 0.455 |
0.026 0.000 | 0.112 |
0.000 0.000 | 0.038 |
0.075 0.000 | 0.207 |
0.000 0.000 | 0.066 |
0.527 0.386 | 0.621 |
0.000 0.000 | 0.050 |
|||
| Plot | Lyso | Other | |||||||||||
| Expt C |
7 peptides |
33 spectra |
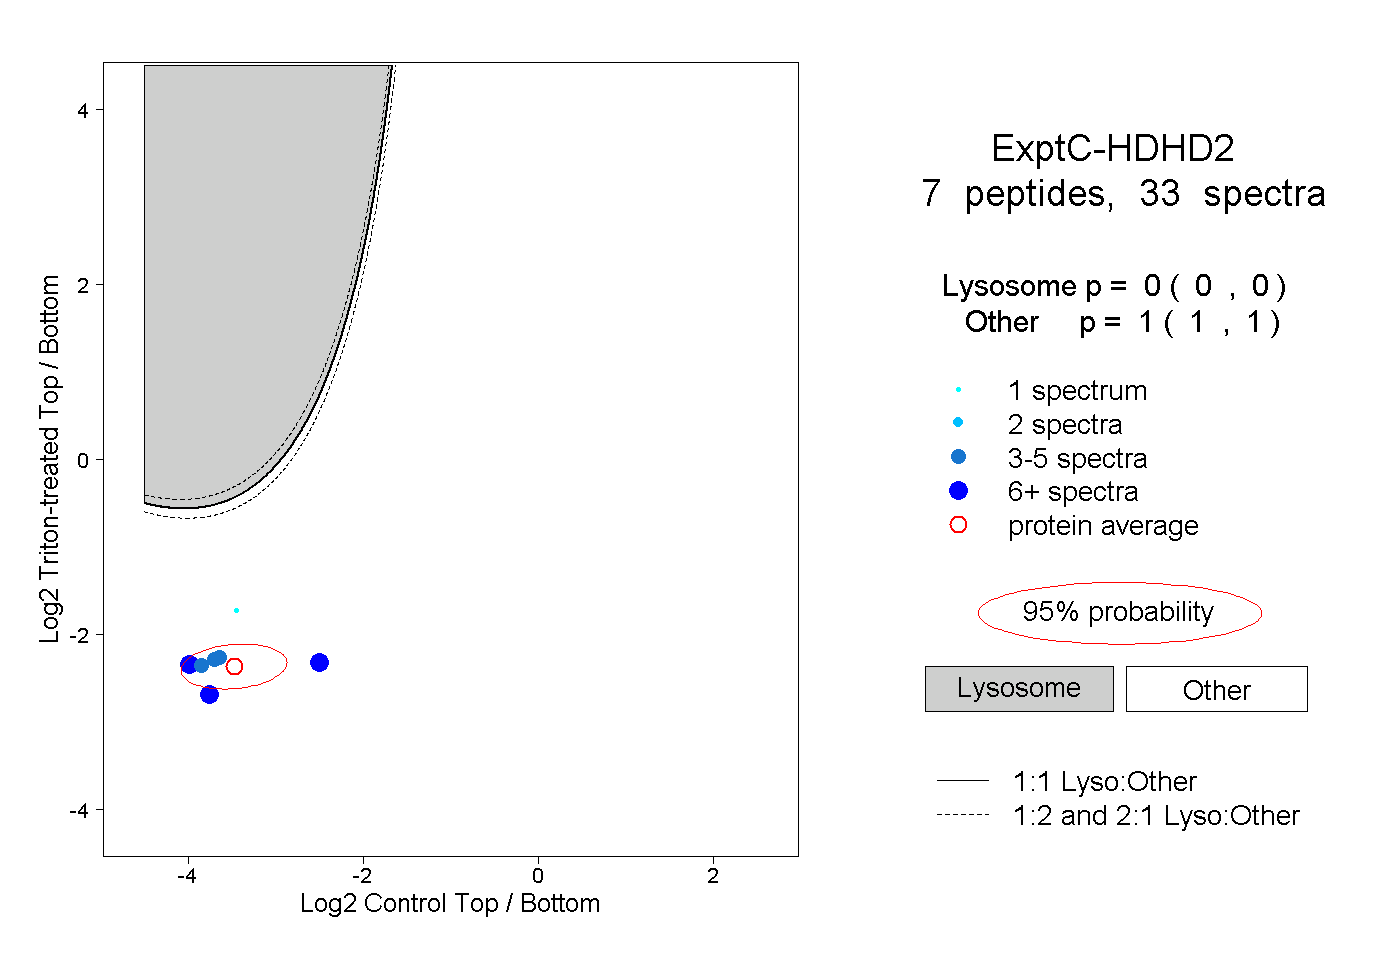 |
0.000 0.000 | 0.000 |
1.000 1.000 | 1.000 |
||||||||
| Plot | Lyso | Other | |||||||||||
| Expt D |
1 peptide |
2 spectra |
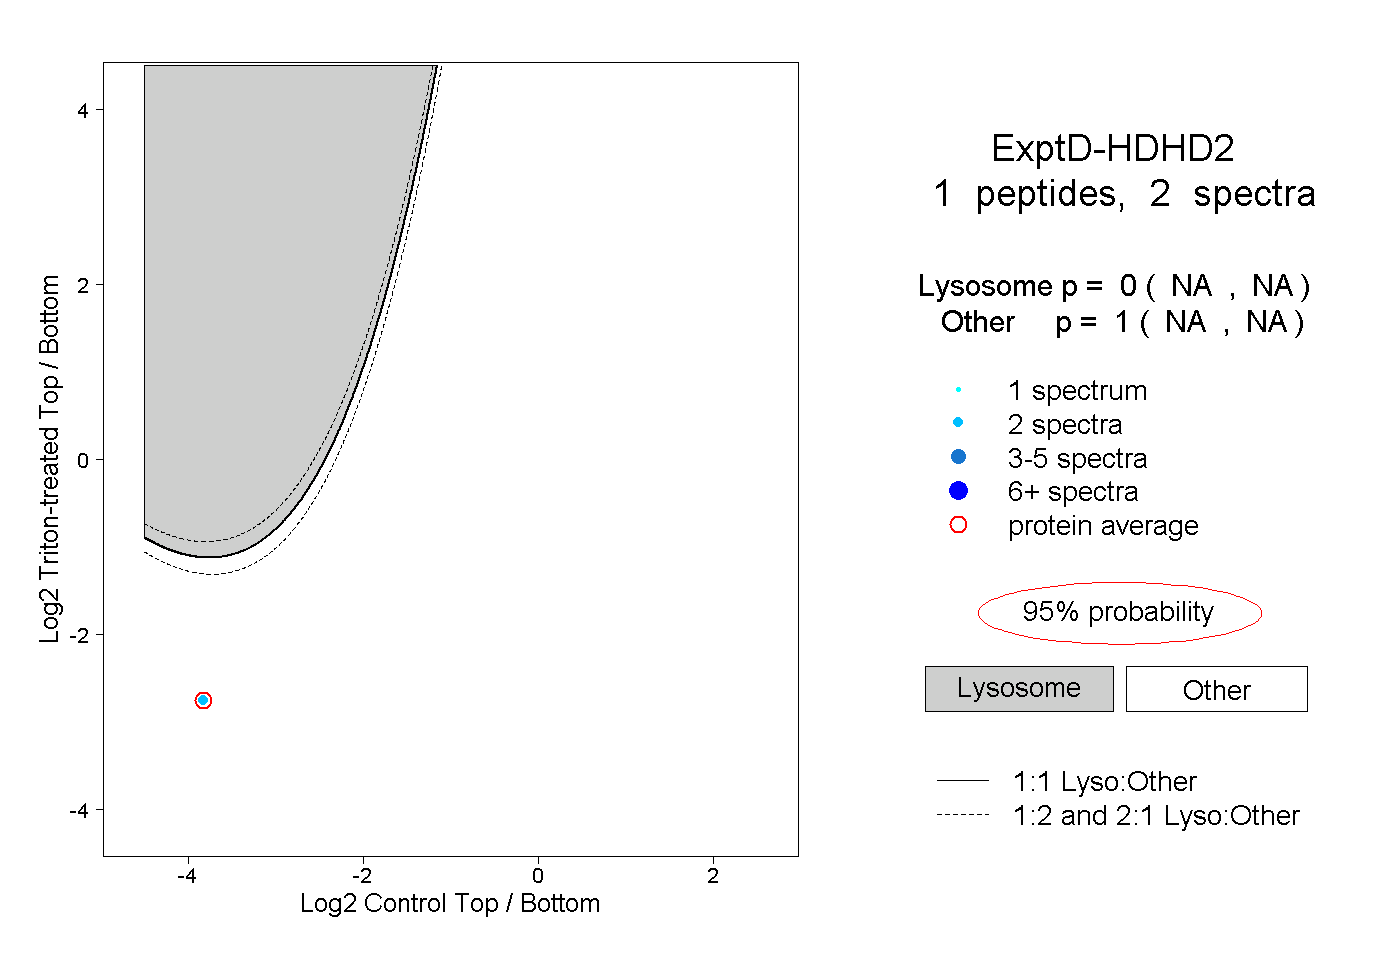 |
0.000 NA | NA |
1.000 NA | NA |