 20
20peptides
spectra
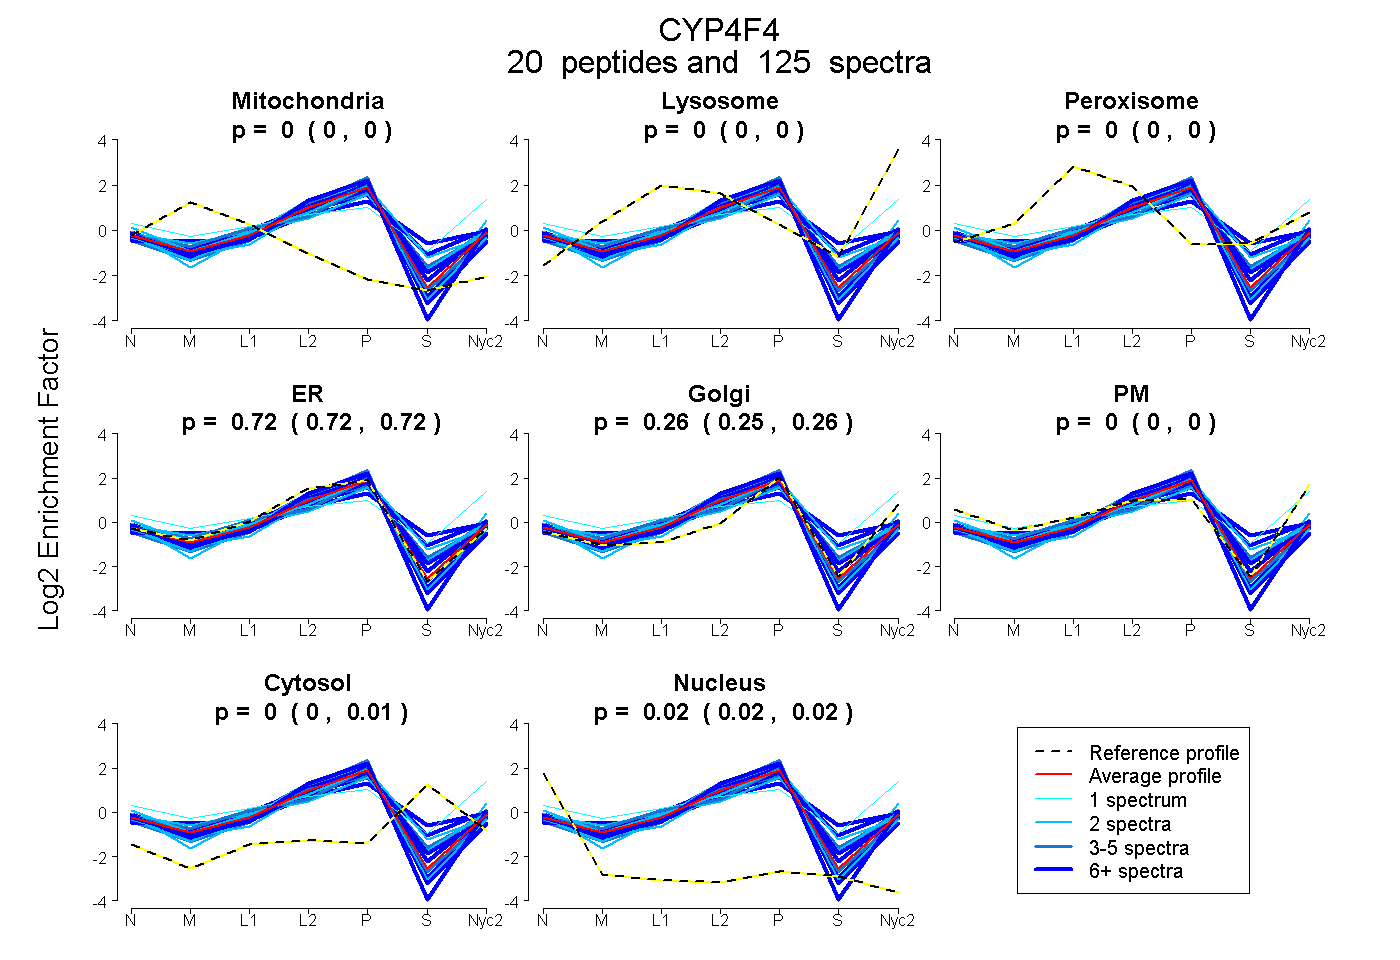
0.000 | 0.000
0.000 | 0.000
0.000 | 0.000
0.716 | 0.723
0.251 | 0.260
0.000 | 0.000
0.000 | 0.008
0.019 | 0.024
11peptides
spectra
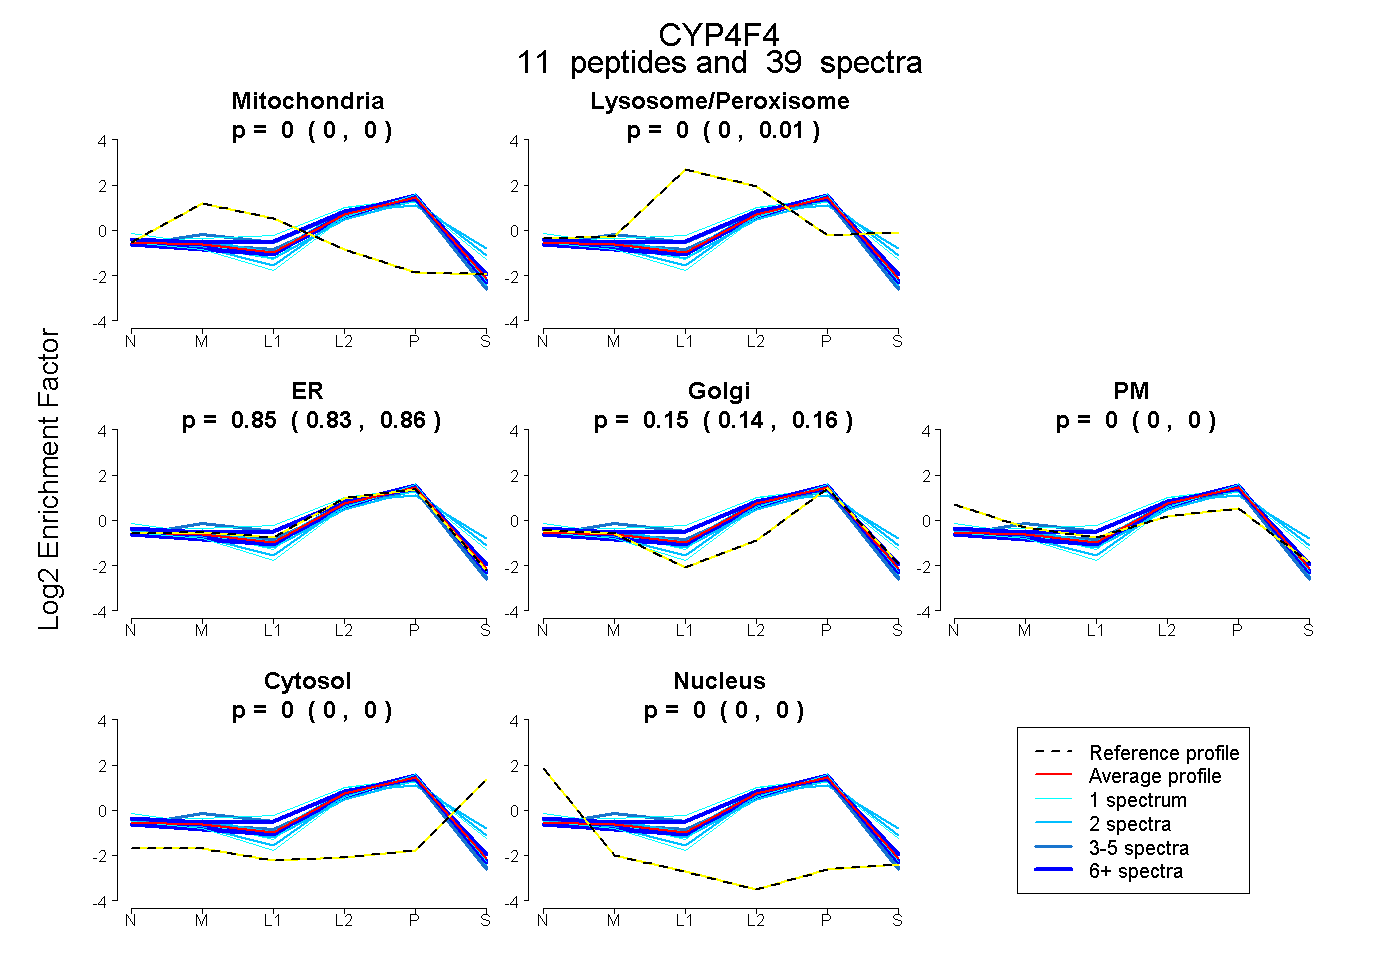
0.000 | 0.000
0.000 | 0.007
0.834 | 0.860
0.138 | 0.158
0.000 | 0.000
0.000 | 0.001
0.000 | 0.000
10peptides
spectra
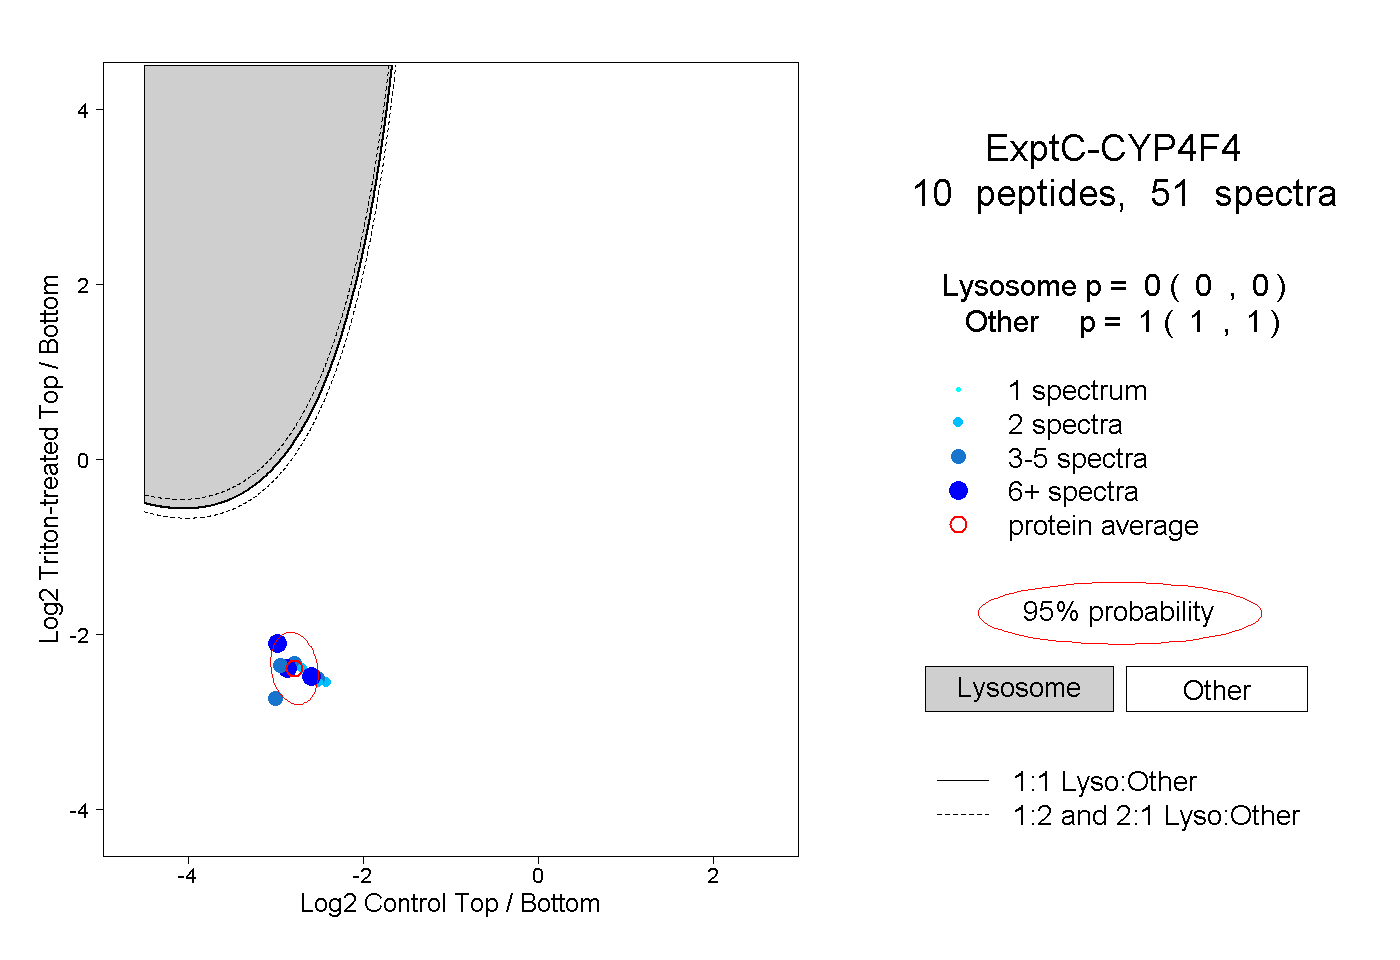
0.000 | 0.000
1.000 | 1.000
4peptides
spectra
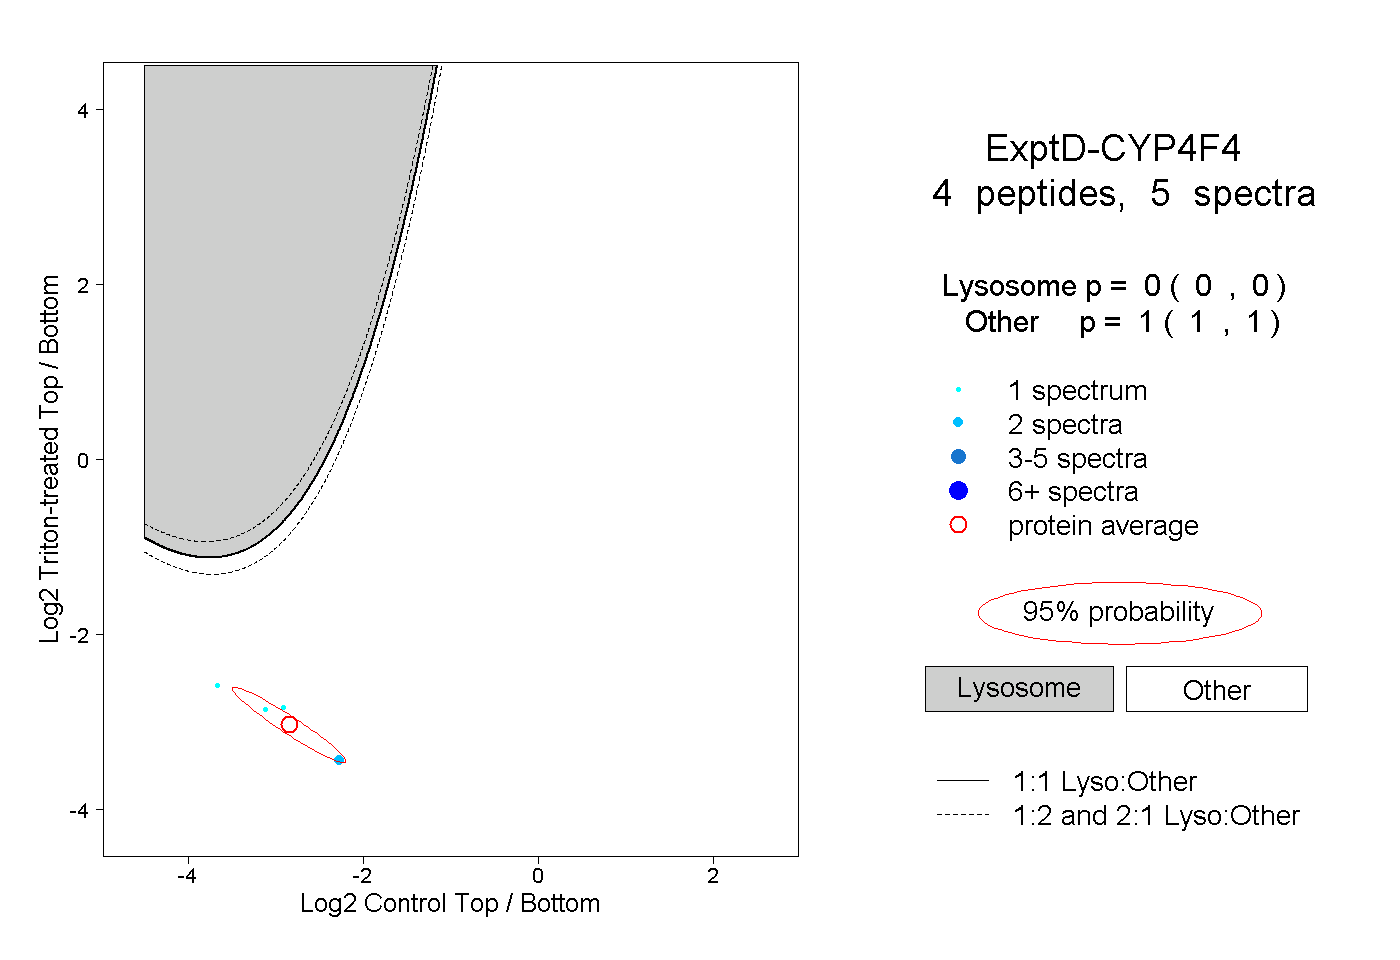
0.000 | 0.000
1.000 | 1.000