CYP4F4
[ENSRNOP00000039545]
Main page
| | | Plot |
Mito |
Lyso |
|
Perox |
ER |
Golgi |
PM |
Cytosol |
Nucleus |
|
| Expt A |
 20
20
peptides |
125
spectra |
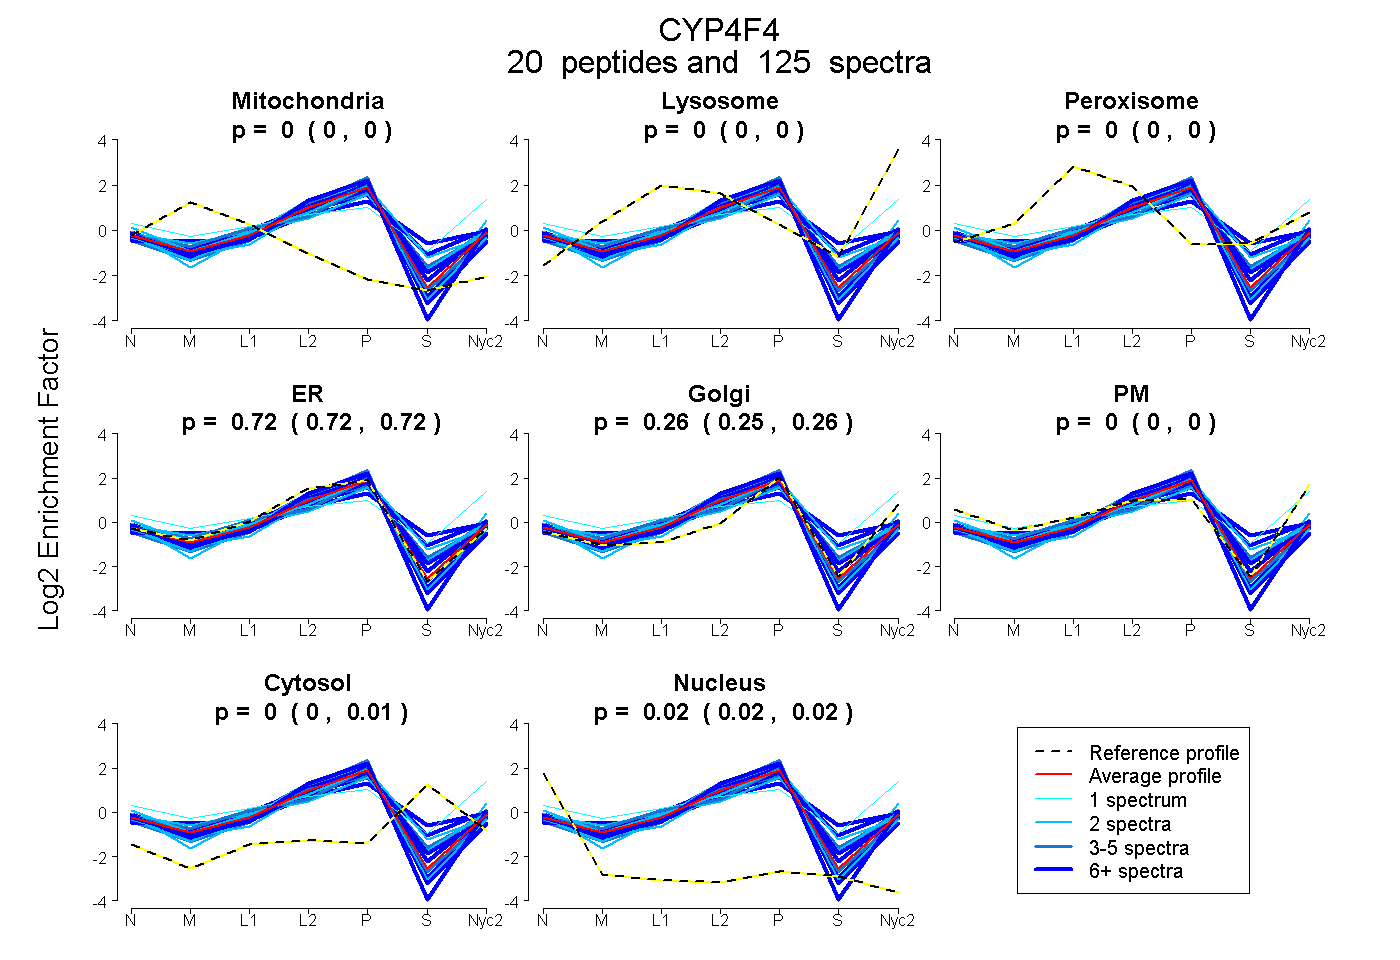 |
0.000
0.000 | 0.000 |
0.000
0.000 | 0.000 |
|
0.000
0.000 | 0.000 |
0.719
0.716 | 0.723 |
0.256
0.251 | 0.260 |
0.000
0.000 | 0.000 |
0.002
0.000 | 0.008 |
0.022
0.019 | 0.024 |
|
| | | Plot |
Mito |
|
Lyso or Perox |
|
ER |
Golgi |
PM |
Cytosol |
Nucleus |
|
| Expt B |
11
peptides |
39
spectra |
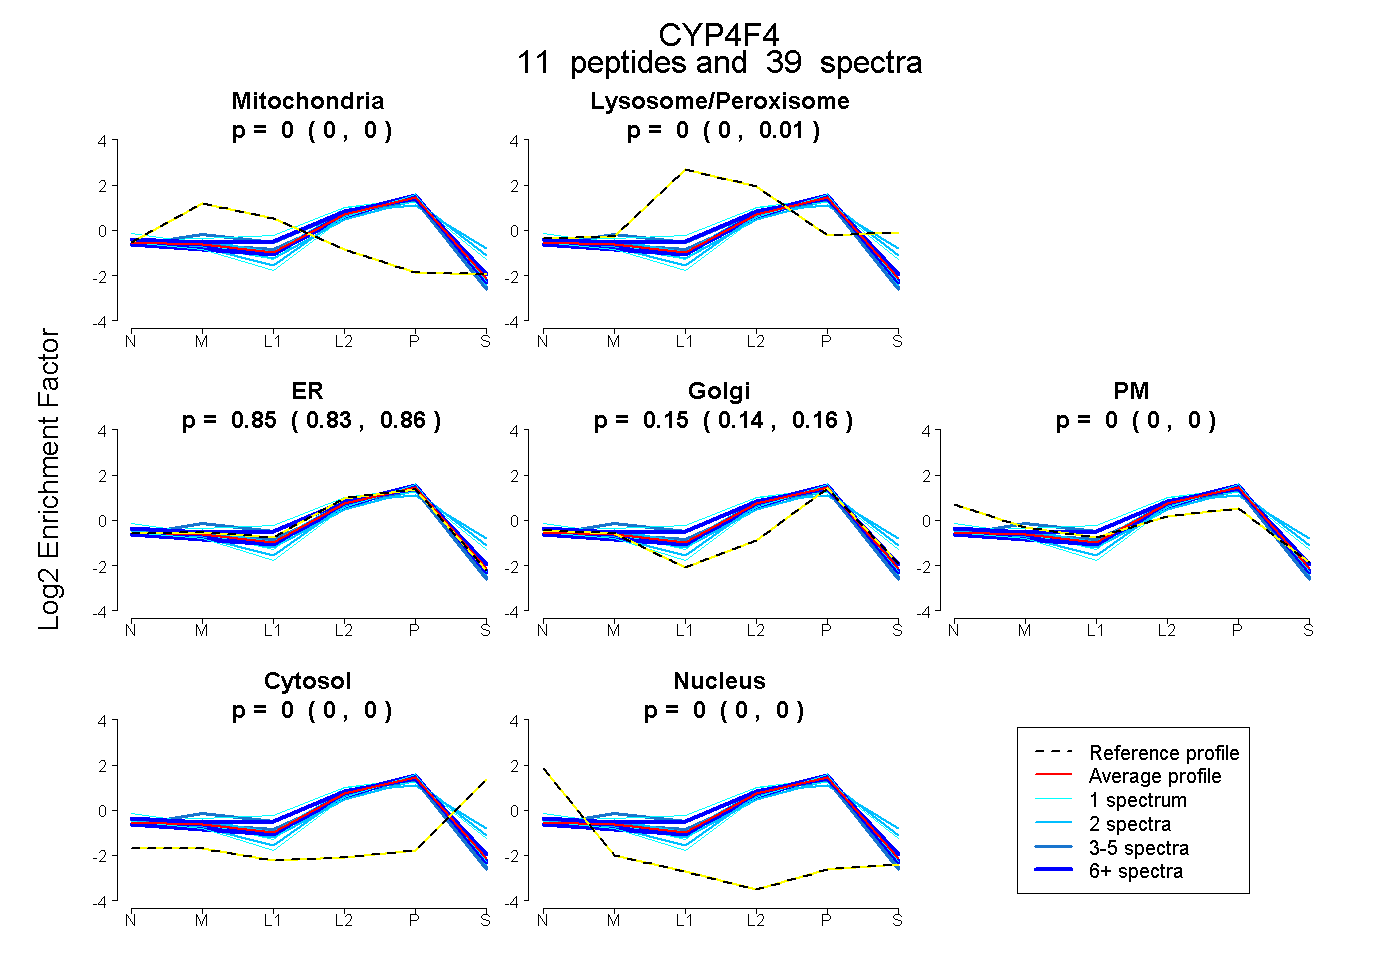 |
0.000
0.000 | 0.000 |
|
0.000
0.000 | 0.007 |
|
0.852
0.834 | 0.860 |
0.148
0.138 | 0.158 |
0.000
0.000 | 0.000 |
0.000
0.000 | 0.001 |
0.000
0.000 | 0.000 |
|
| 3 spectra, LVHNFTDAVIQGR |
0.071 |
|
0.000 |
|
0.929 |
0.000 |
0.000 |
0.000 |
0.000 |
|
| 4 spectra, AEGGLWLR |
0.000 |
|
0.000 |
|
0.854 |
0.137 |
0.000 |
0.000 |
0.009 |
|
| 8 spectra, TLDFIDVLLLTK |
0.000 |
|
0.000 |
|
0.847 |
0.153 |
0.000 |
0.000 |
0.000 |
|
| 2 spectra, SVLSASASVALK |
0.000 |
|
0.000 |
|
0.693 |
0.307 |
0.000 |
0.000 |
0.000 |
|
| 7 spectra, LHPPVTVISR |
0.000 |
|
0.000 |
|
0.809 |
0.191 |
0.000 |
0.000 |
0.000 |
|
| 2 spectra, IFNDSTNIMHAK |
0.000 |
|
0.125 |
|
0.649 |
0.083 |
0.000 |
0.143 |
0.000 |
|
| 1 spectrum, NISLMTLDSLQK |
0.000 |
|
0.263 |
|
0.546 |
0.191 |
0.000 |
0.000 |
0.000 |
|
| 2 spectra, FDPENIK |
0.000 |
|
0.057 |
|
0.597 |
0.227 |
0.000 |
0.119 |
0.000 |
|
| 1 spectrum, WQDLASGGSAR |
0.000 |
|
0.000 |
|
0.602 |
0.398 |
0.000 |
0.000 |
0.000 |
|
| 8 spectra, VAIALTLLR |
0.000 |
|
0.088 |
|
0.772 |
0.087 |
0.053 |
0.000 |
0.000 |
|
| 1 spectrum, PQLDLSWLGLR |
0.000 |
|
0.000 |
|
0.808 |
0.090 |
0.101 |
0.000 |
0.001 |
|
| | | Plot |
|
Lyso |
|
|
|
|
|
|
|
Other |
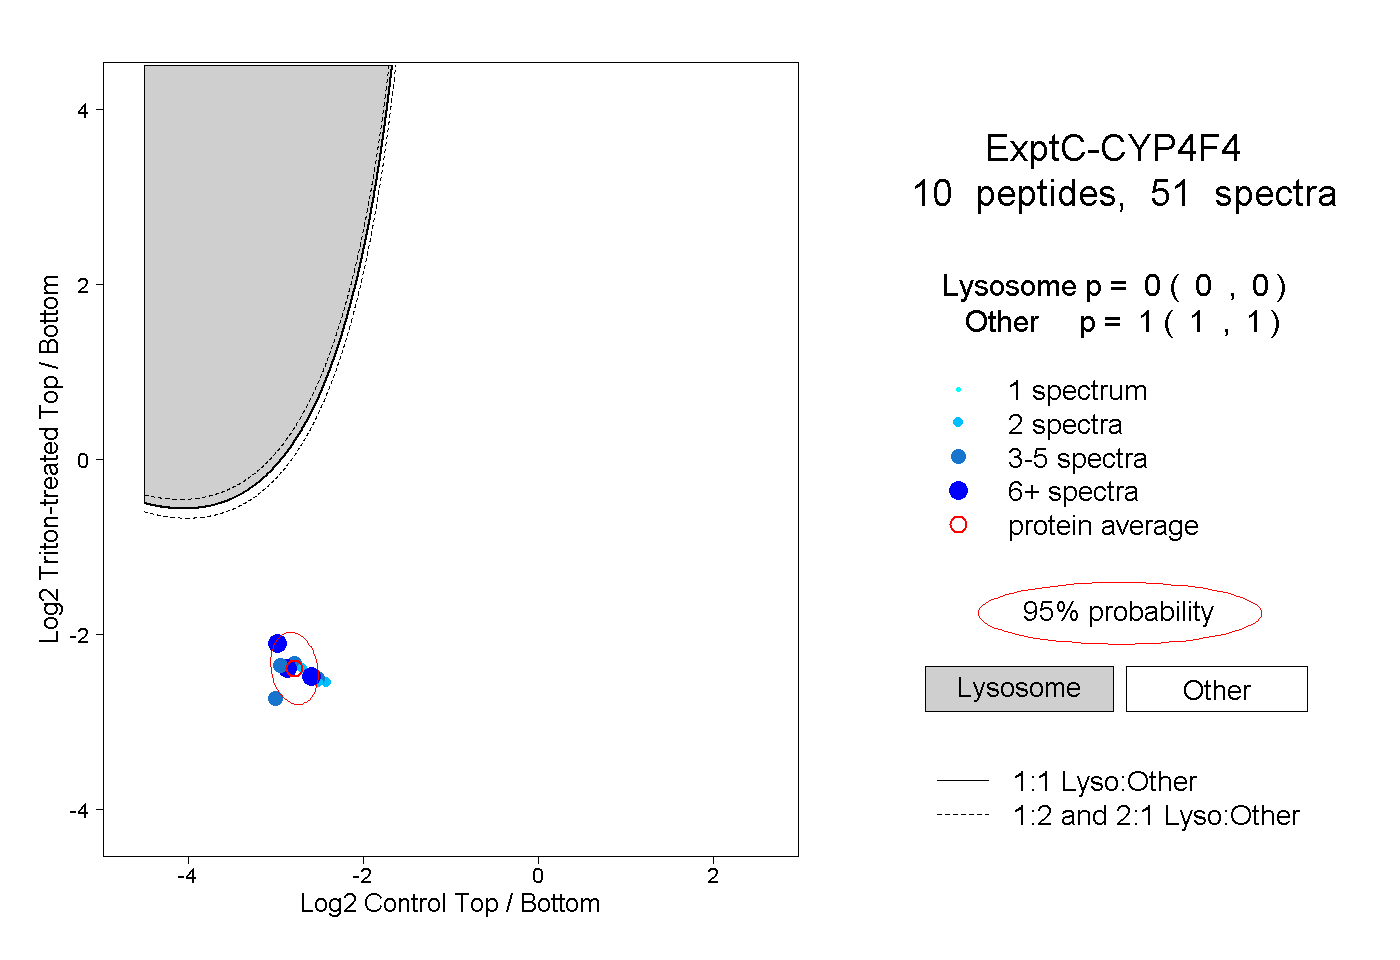
| Expt C |
10
peptides |
51
spectra |
 |
|
0.000
0.000 | 0.000 |
|
|
|
|
|
|
|
1.000
1.000 | 1.000 |
| | | Plot |
|
Lyso |
|
|
|
|
|
|
|
Other |
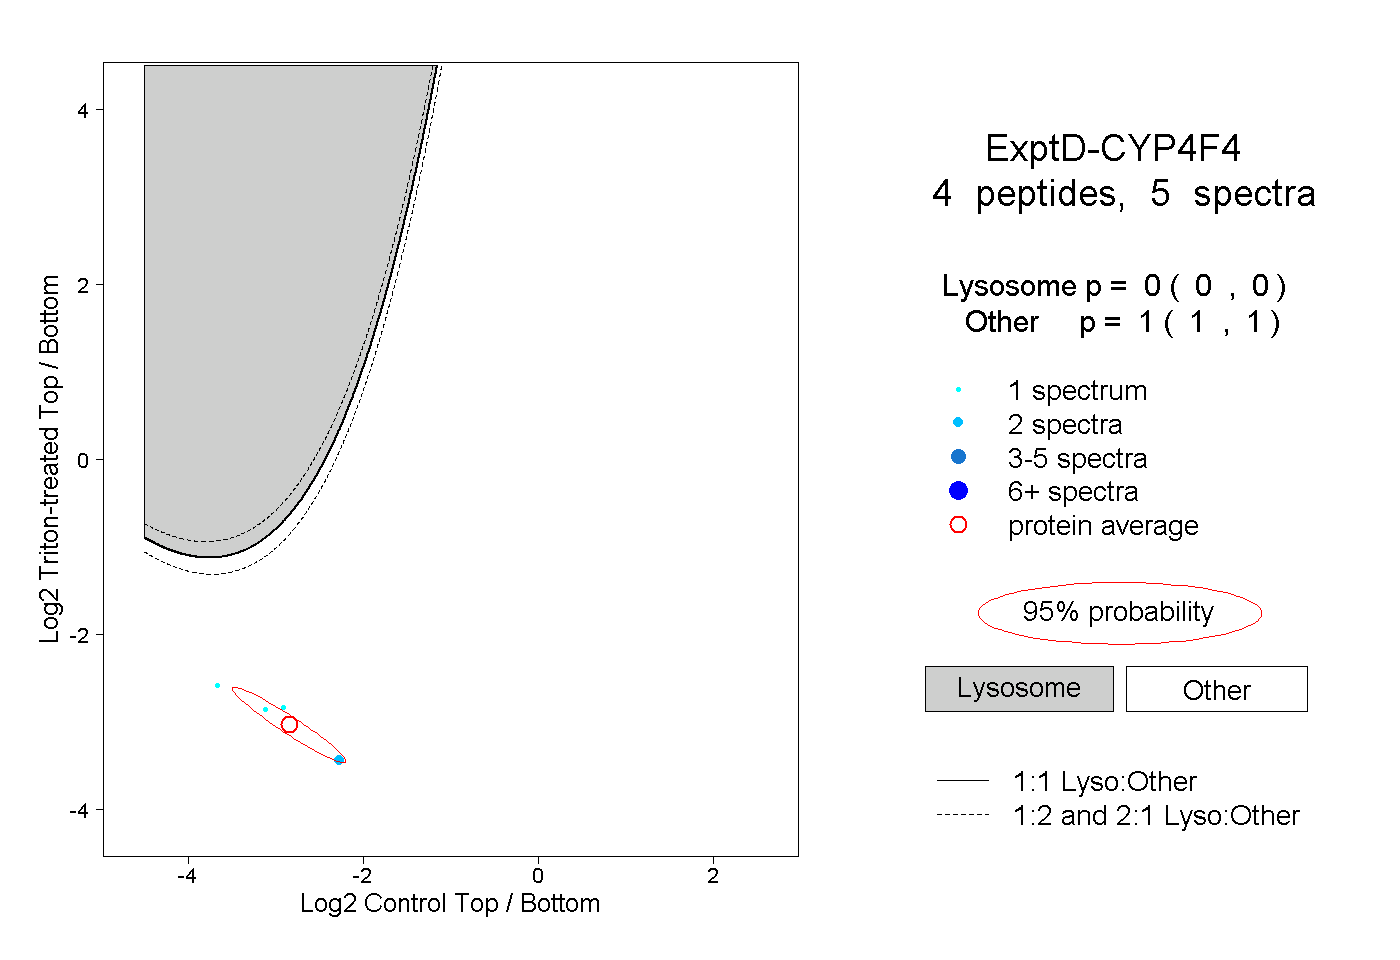
| Expt D |
4
peptides |
5
spectra |
 |
|
0.000
0.000 | 0.000 |
|
|
|
|
|
|
|
1.000
1.000 | 1.000 |