 20
20peptides
spectra
0.000 | 0.000
0.000 | 0.000
0.000 | 0.000
0.716 | 0.723
0.251 | 0.260
0.000 | 0.000
0.000 | 0.008
0.019 | 0.024
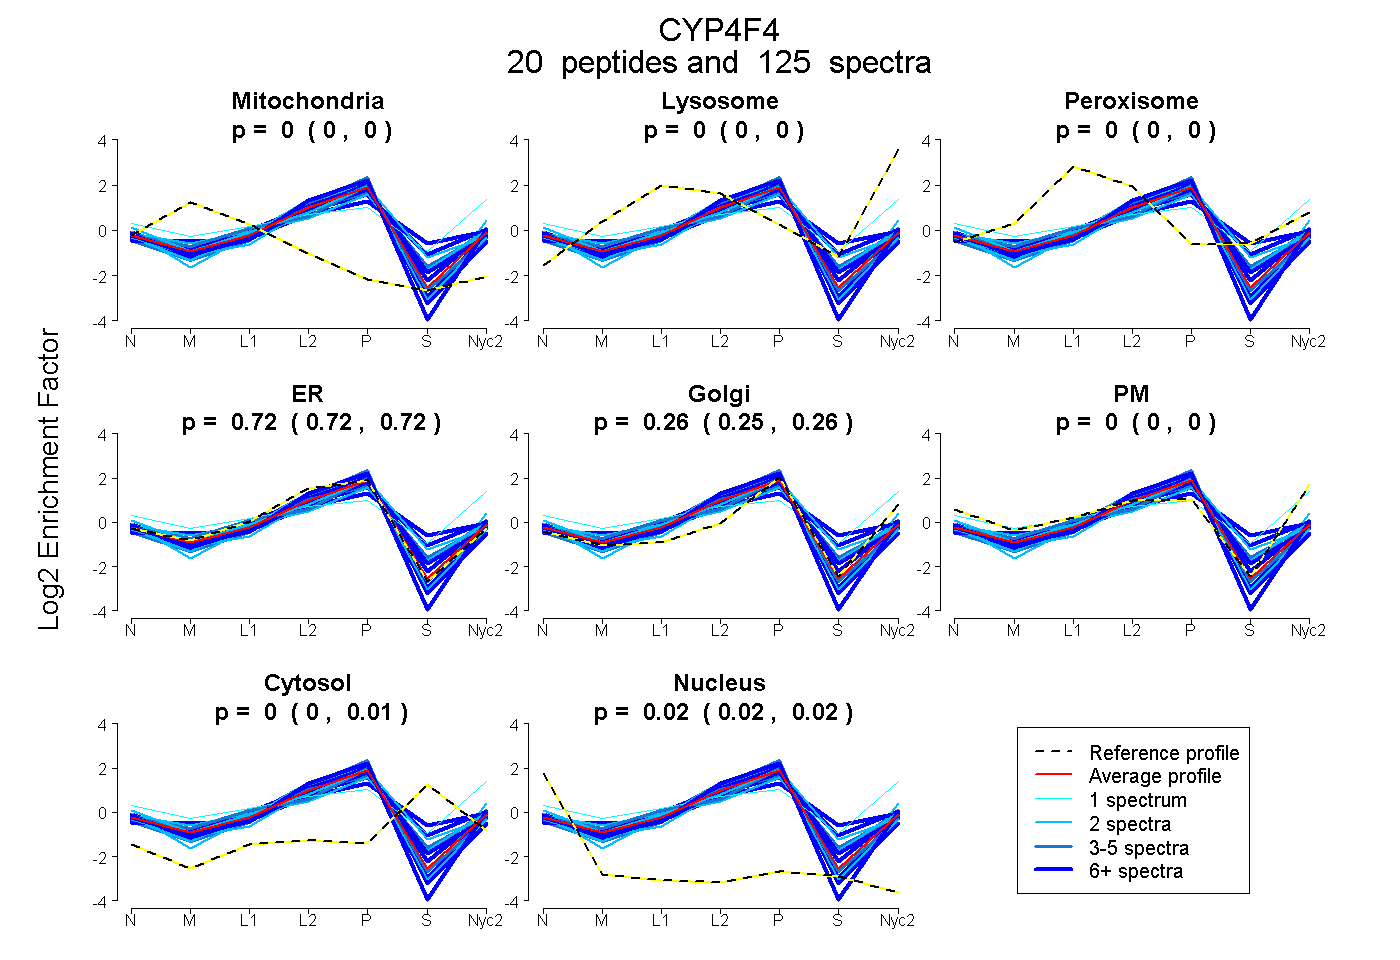
| Plot | Mito | Lyso | Perox | ER | Golgi | PM | Cytosol | Nucleus | |||||
| Expt A |
20 peptides |
125 spectra |
|
0.000 0.000 | 0.000 |
0.000 0.000 | 0.000 |
0.000 0.000 | 0.000 |
0.719 0.716 | 0.723 |
0.256 0.251 | 0.260 |
0.000 0.000 | 0.000 |
0.002 0.000 | 0.008 |
0.022 0.019 | 0.024 |
| 2 spectra, MLTPAFHFNILKPYVK | 0.000 | 0.000 | 0.000 | 0.841 | 0.143 | 0.000 | 0.000 | 0.016 | ||
| 10 spectra, AEGGLWLR | 0.000 | 0.000 | 0.000 | 0.876 | 0.084 | 0.000 | 0.000 | 0.039 | ||
| 8 spectra, TLDFIDVLLLTK | 0.000 | 0.000 | 0.000 | 0.684 | 0.188 | 0.000 | 0.127 | 0.000 | ||
| 2 spectra, SVLSASASVALK | 0.034 | 0.000 | 0.115 | 0.369 | 0.410 | 0.000 | 0.071 | 0.000 | ||
| 6 spectra, NISLMTLDSLQK | 0.000 | 0.000 | 0.170 | 0.344 | 0.255 | 0.000 | 0.231 | 0.000 | ||
| 7 spectra, FDPENIK | 0.000 | 0.000 | 0.000 | 0.744 | 0.222 | 0.000 | 0.000 | 0.034 | ||
| 3 spectra, ELSDEDIR | 0.000 | 0.000 | 0.000 | 0.729 | 0.271 | 0.000 | 0.000 | 0.000 | ||
| 4 spectra, ALPSQHEDDILK | 0.000 | 0.000 | 0.097 | 0.578 | 0.282 | 0.000 | 0.042 | 0.000 | ||
| 7 spectra, LVHNFTDAVIQGR | 0.011 | 0.000 | 0.000 | 0.785 | 0.204 | 0.000 | 0.000 | 0.000 | ||
| 24 spectra, LHPPVTVISR | 0.000 | 0.000 | 0.000 | 0.788 | 0.191 | 0.000 | 0.000 | 0.022 | ||
| 3 spectra, TYQHLCDFPQPPK | 0.070 | 0.000 | 0.000 | 0.650 | 0.277 | 0.000 | 0.000 | 0.003 | ||
| 12 spectra, IFNDSTNIMHAK | 0.000 | 0.018 | 0.080 | 0.496 | 0.220 | 0.000 | 0.186 | 0.000 | ||
| 2 spectra, VLTQTYIFYR | 0.000 | 0.000 | 0.000 | 0.765 | 0.180 | 0.002 | 0.000 | 0.054 | ||
| 5 spectra, CTQDIVLPDGR | 0.000 | 0.000 | 0.000 | 0.845 | 0.155 | 0.000 | 0.000 | 0.000 | ||
| 3 spectra, NCIGQTFAMNEMK | 0.000 | 0.000 | 0.012 | 0.683 | 0.069 | 0.078 | 0.157 | 0.000 | ||
| 7 spectra, WQDLASGGSAR | 0.000 | 0.000 | 0.000 | 0.801 | 0.199 | 0.000 | 0.000 | 0.000 | ||
| 1 spectrum, VEPLSTQ | 0.000 | 0.067 | 0.092 | 0.000 | 0.051 | 0.640 | 0.151 | 0.000 | ||
| 15 spectra, HPEYQER | 0.000 | 0.000 | 0.000 | 0.676 | 0.233 | 0.034 | 0.053 | 0.004 | ||
| 2 spectra, PQLDLSWLGLR | 0.000 | 0.000 | 0.000 | 0.645 | 0.165 | 0.000 | 0.189 | 0.000 | ||
| 2 spectra, KPELILR | 0.000 | 0.000 | 0.000 | 0.625 | 0.364 | 0.011 | 0.000 | 0.000 |
| Plot | Mito | Lyso or Perox | ER | Golgi | PM | Cytosol | Nucleus | ||||||
| Expt B |
11 peptides |
39 spectra |
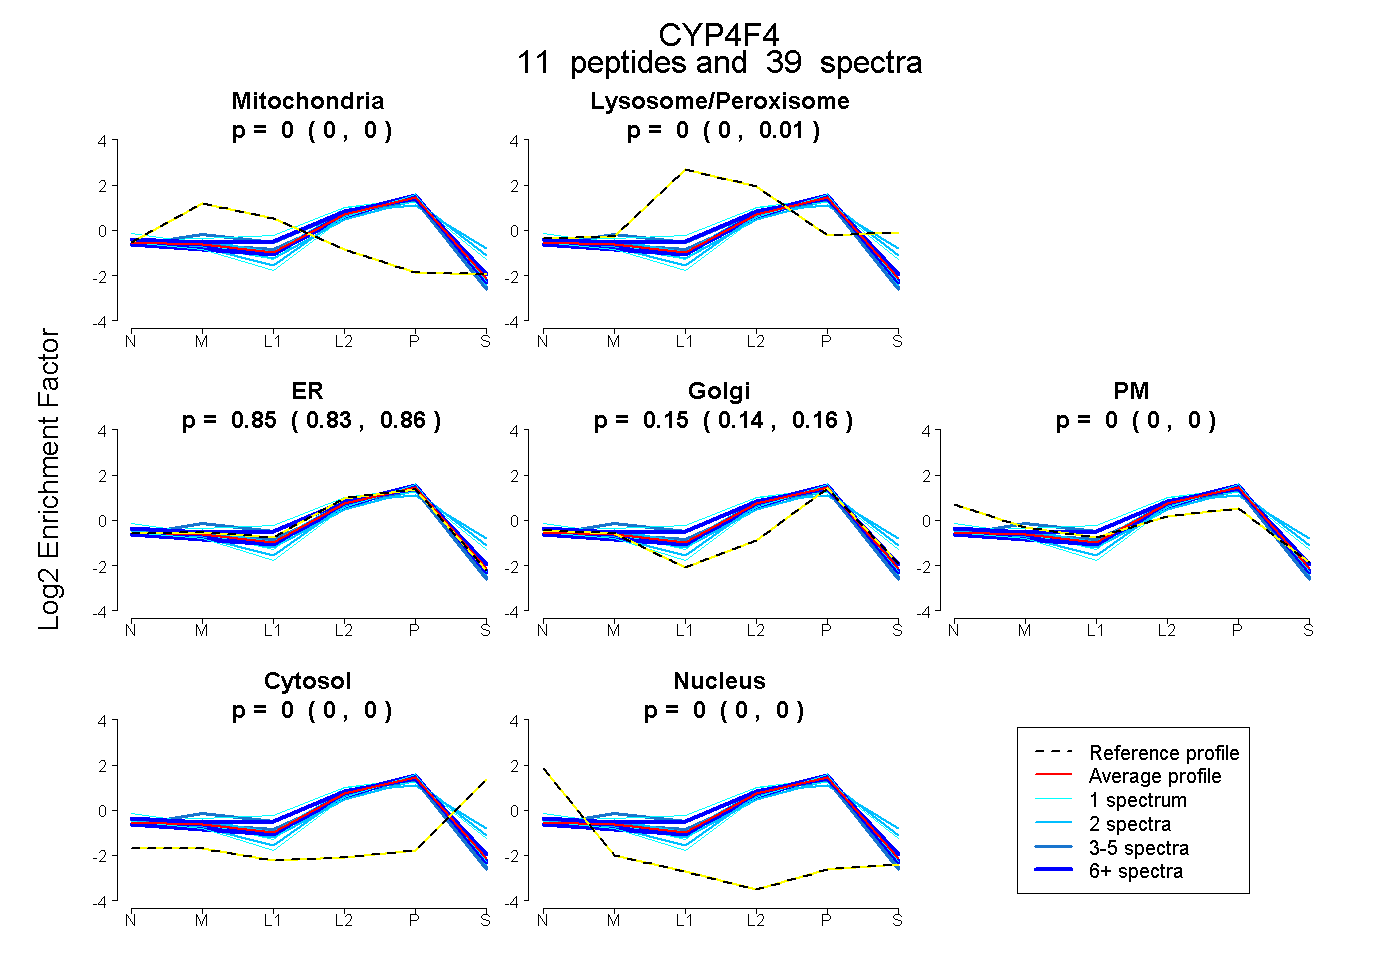 |
0.000 0.000 | 0.000 |
0.000 0.000 | 0.007 |
0.852 0.834 | 0.860 |
0.148 0.138 | 0.158 |
0.000 0.000 | 0.000 |
0.000 0.000 | 0.001 |
0.000 0.000 | 0.000 |
|||
| Plot | Lyso | Other | |||||||||||
| Expt C |
10 peptides |
51 spectra |
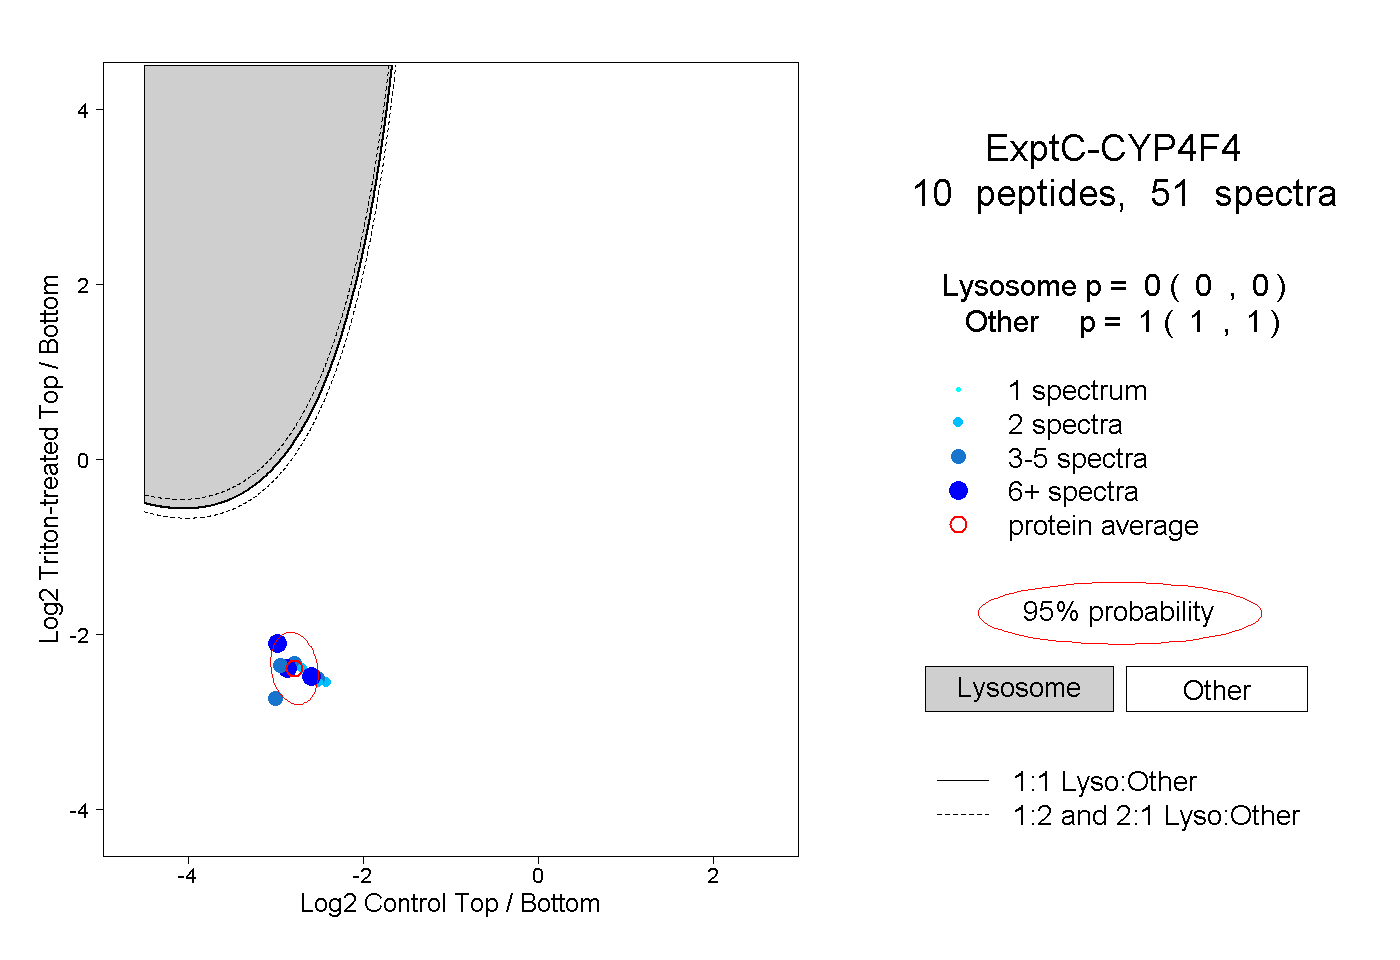 |
0.000 0.000 | 0.000 |
1.000 1.000 | 1.000 |
||||||||
| Plot | Lyso | Other | |||||||||||
| Expt D |
4 peptides |
5 spectra |
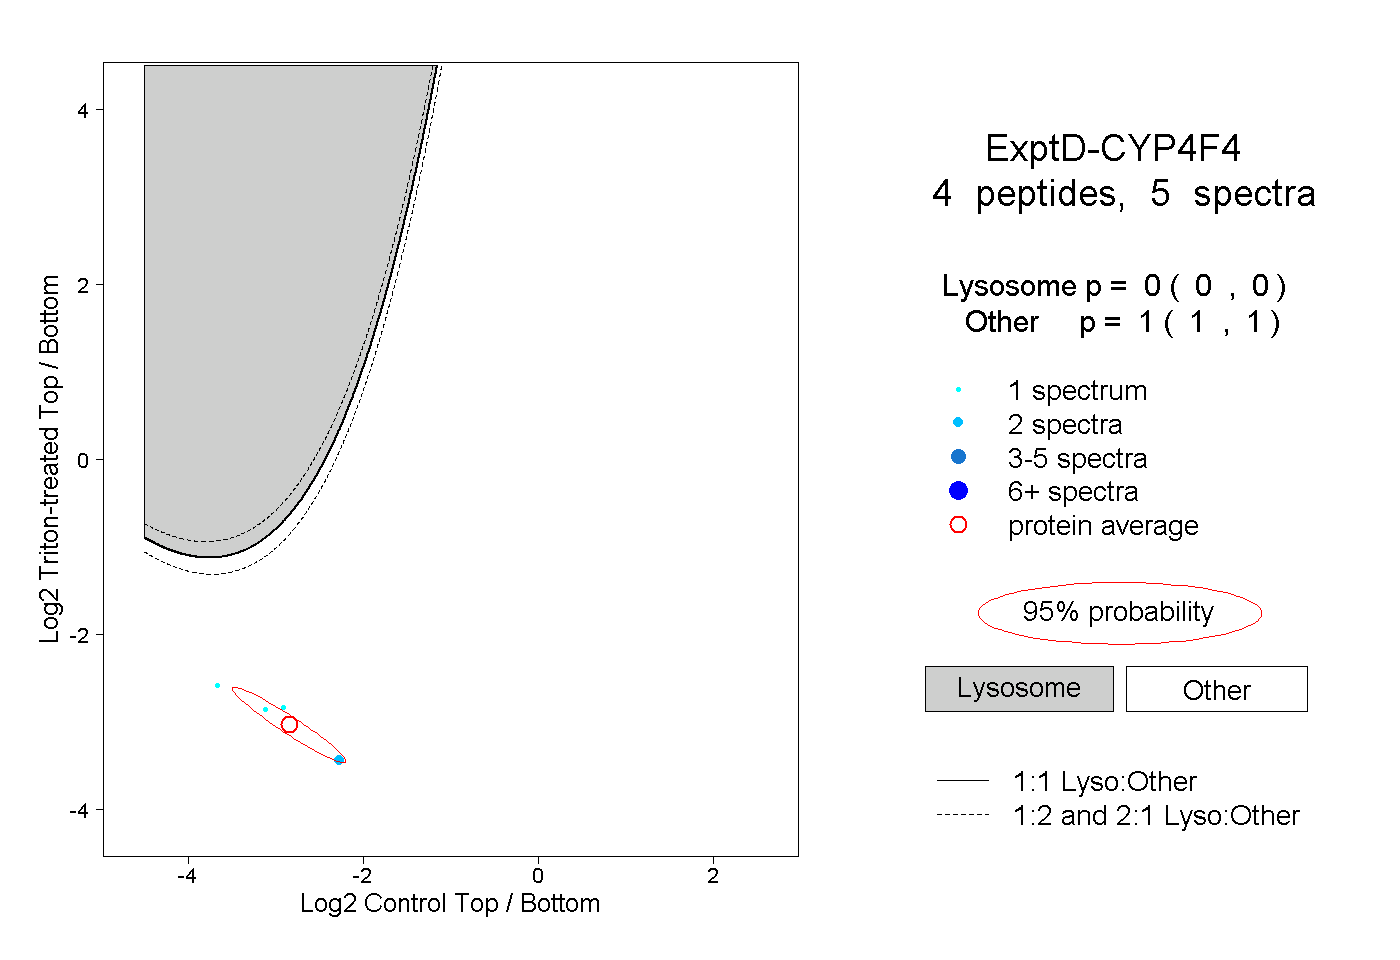 |
0.000 0.000 | 0.000 |
1.000 1.000 | 1.000 |