 3
3peptides
spectra
0.000 | 0.000
0.172 | 0.227
0.000 | 0.000
0.000 | 0.000
0.126 | 0.171
0.000 | 0.027
0.619 | 0.661
0.000 | 0.000
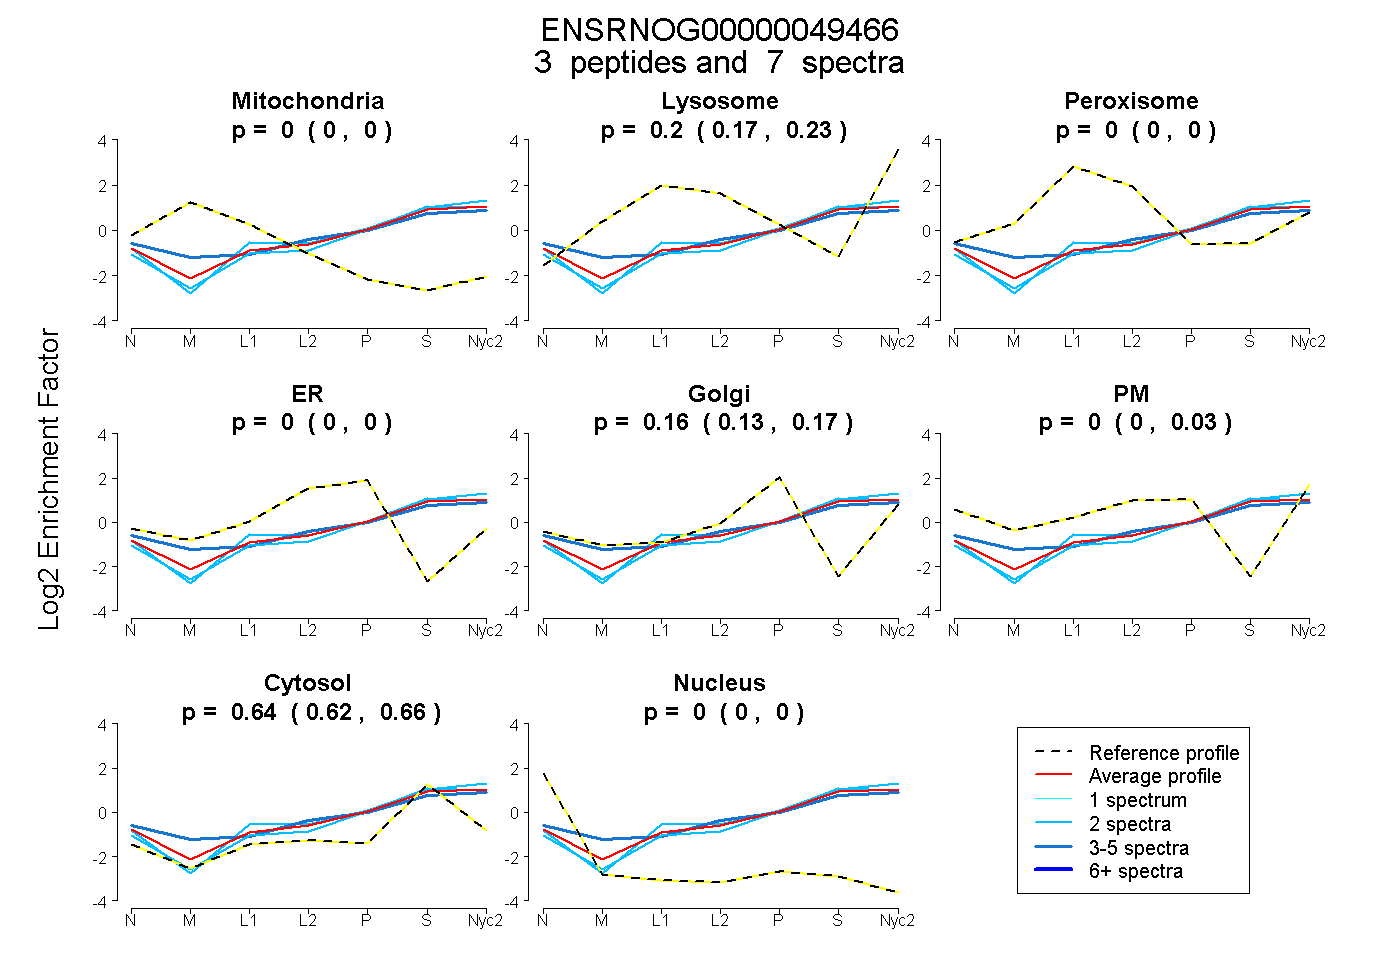
| Plot | Mito | Lyso | Perox | ER | Golgi | PM | Cytosol | Nucleus | |||||
| Expt A |
3 peptides |
7 spectra |
|
0.000 0.000 | 0.000 |
0.203 0.172 | 0.227 |
0.000 0.000 | 0.000 |
0.000 0.000 | 0.000 |
0.155 0.126 | 0.171 |
0.000 0.000 | 0.027 |
0.642 0.619 | 0.661 |
0.000 0.000 | 0.000 |
| 3 spectra, TISKPEGR | 0.000 | 0.156 | 0.000 | 0.000 | 0.070 | 0.181 | 0.594 | 0.000 | ||
| 2 spectra, TQVPHVYTMSPTK | 0.000 | 0.155 | 0.000 | 0.000 | 0.143 | 0.000 | 0.703 | 0.000 | ||
| 2 spectra, SVSELPILHQDWLNGR | 0.000 | 0.235 | 0.000 | 0.000 | 0.109 | 0.000 | 0.656 | 0.000 |
| Plot | Mito | Lyso or Perox | ER | Golgi | PM | Cytosol | Nucleus | ||||||
| Expt B |
1 peptide |
2 spectra |
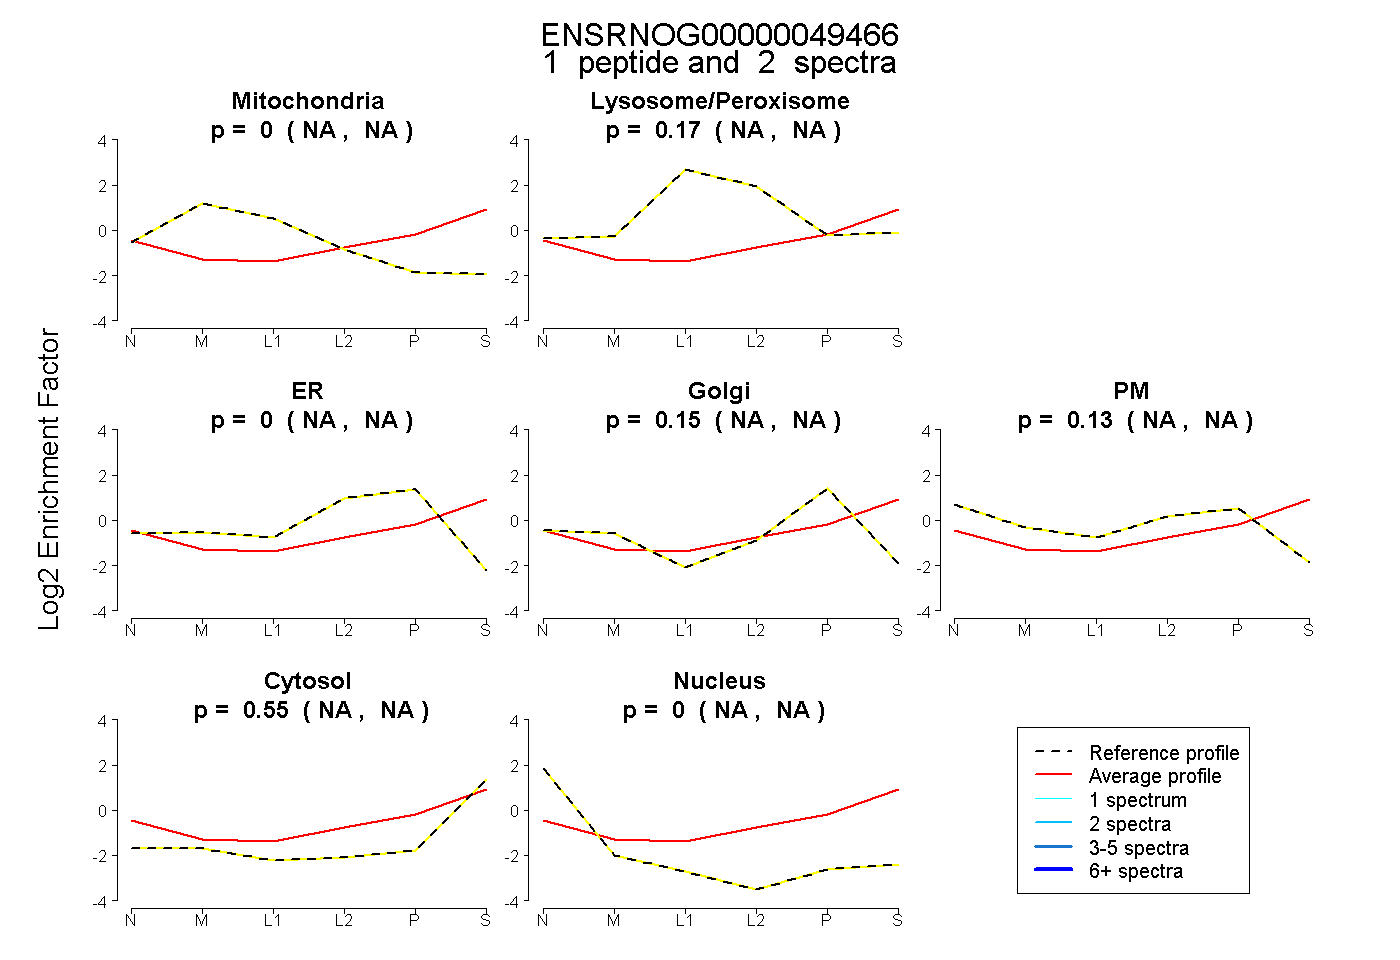 |
0.000 NA | NA |
0.166 NA | NA |
0.000 NA | NA |
0.150 NA | NA |
0.131 NA | NA |
0.554 NA | NA |
0.000 NA | NA |
|||
| Plot | Lyso | Other | |||||||||||
| Expt C |
3 peptides |
4 spectra |
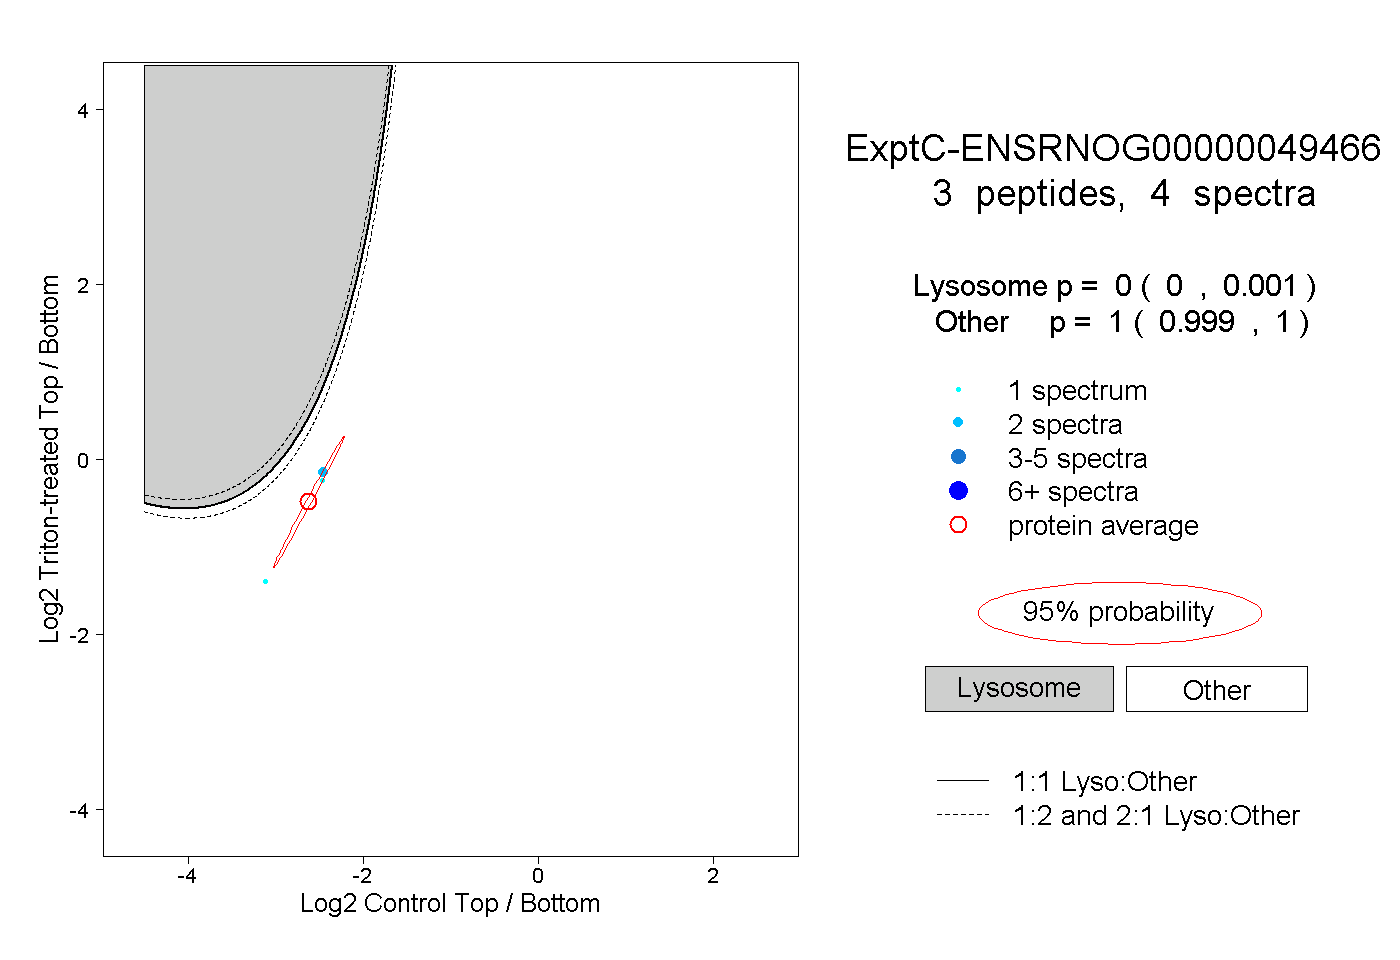 |
0.000 0.000 | 0.001 |
1.000 0.999 | 1.000 |
||||||||
| Plot | Lyso | Other | |||||||||||
| Expt D |
1 peptide |
1 spectrum |
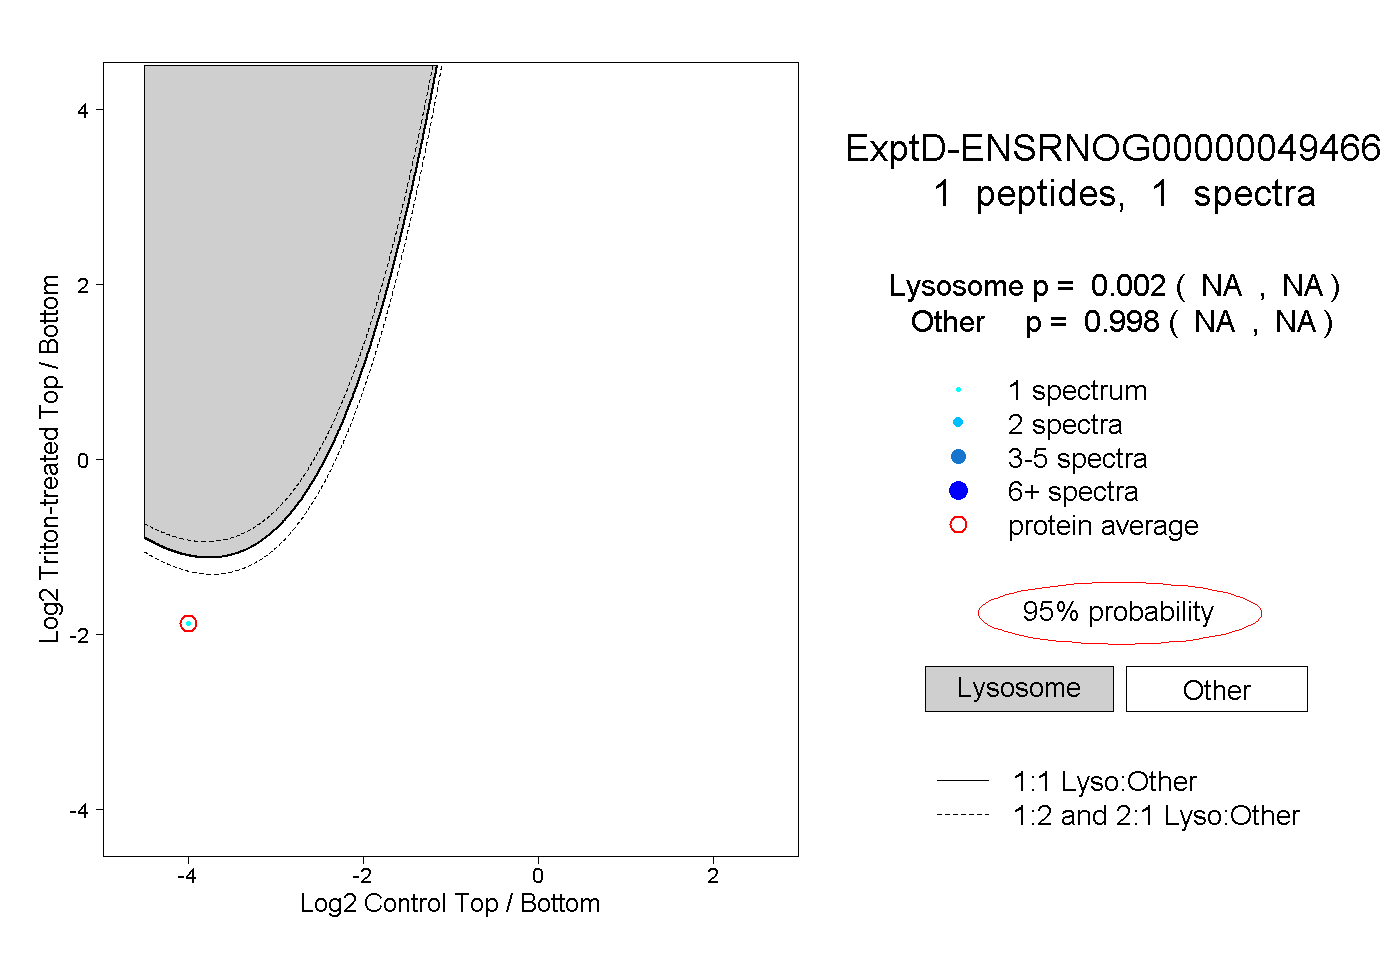 |
0.002 NA | NA |
0.998 NA | NA |