 3
3peptides
spectra
0.000 | 0.006
0.000 | 0.000
0.000 | 0.068
0.000 | 0.499
0.000 | 0.454
0.000 | 0.149
0.333 | 0.452
0.000 | 0.055
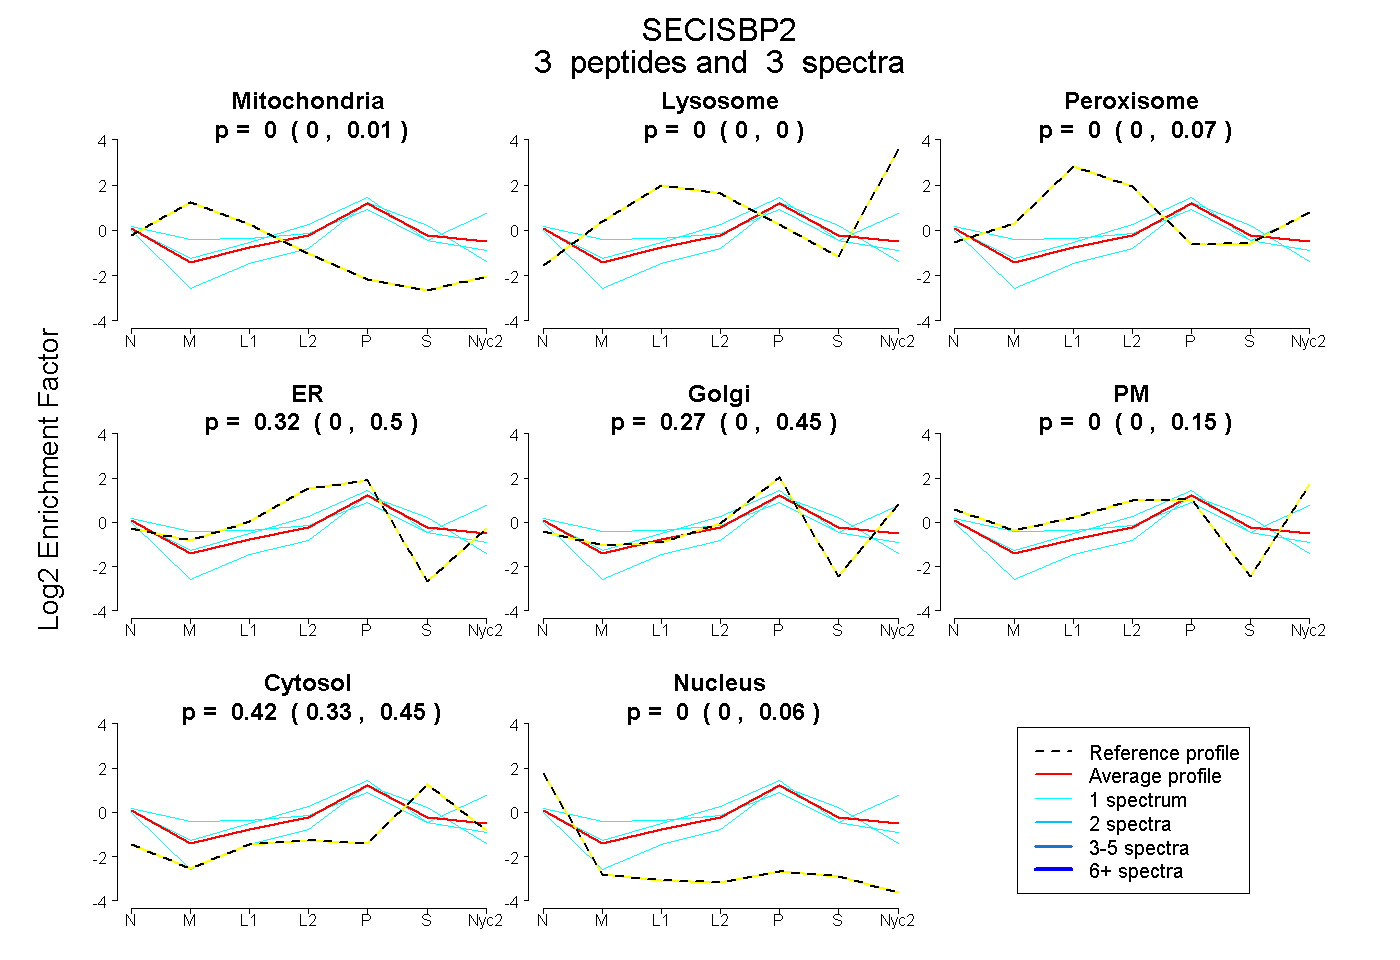
| Plot | Mito | Lyso | Perox | ER | Golgi | PM | Cytosol | Nucleus | |||||
| Expt A |
3 peptides |
3 spectra |
|
0.000 0.000 | 0.006 |
0.000 0.000 | 0.000 |
0.000 0.000 | 0.068 |
0.315 0.000 | 0.499 |
0.266 0.000 | 0.454 |
0.000 0.000 | 0.149 |
0.419 0.333 | 0.452 |
0.000 0.000 | 0.055 |