6
6peptides
spectra
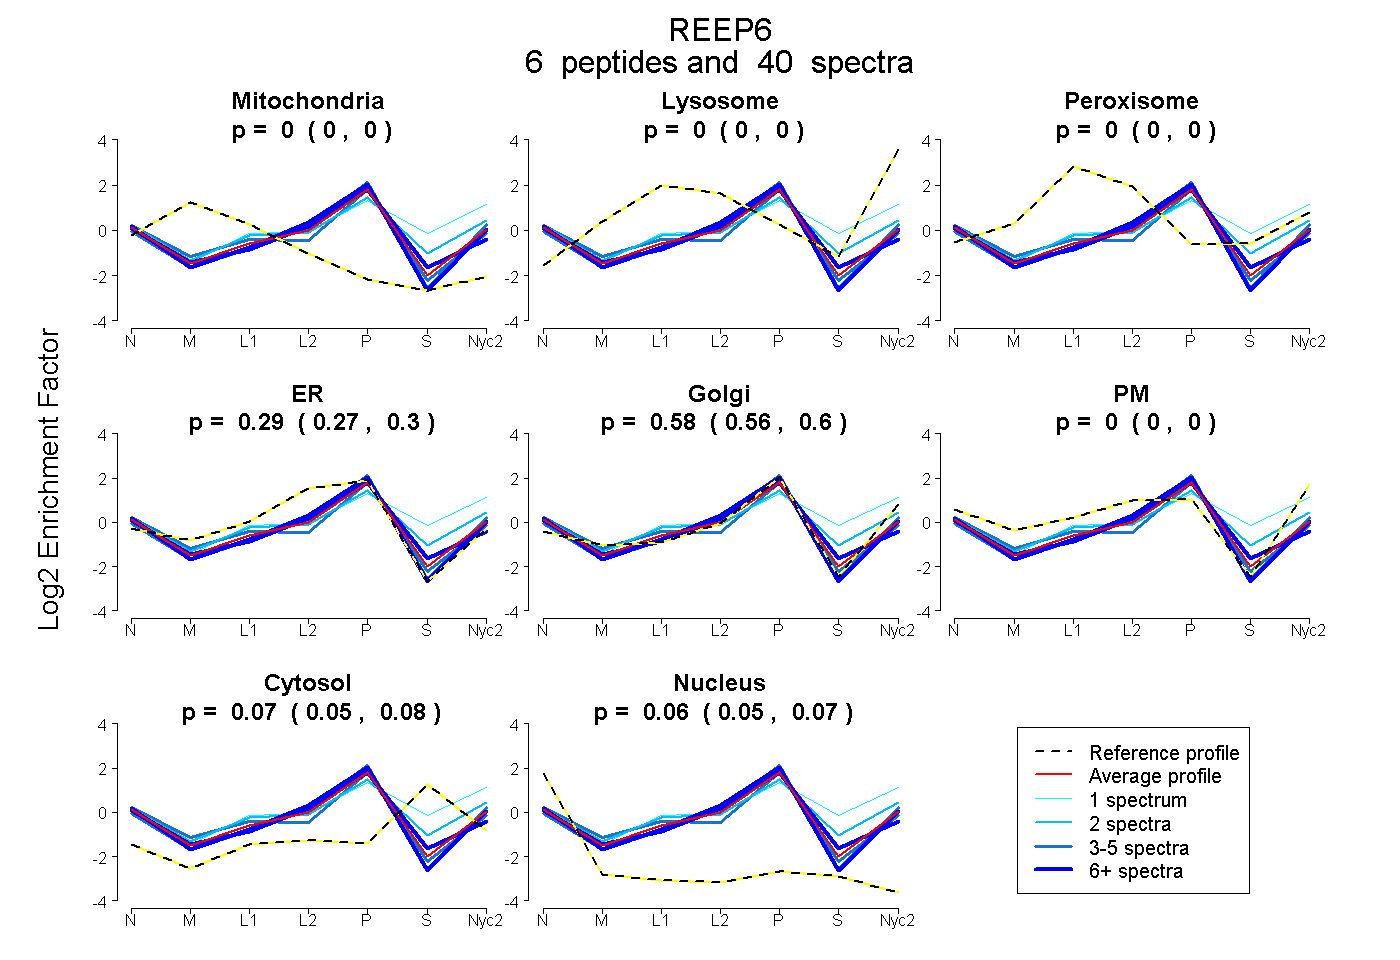
0.000 | 0.000
0.000 | 0.000
0.000 | 0.000
0.267 | 0.299
0.563 | 0.599
0.000 | 0.005
0.051 | 0.083
0.055 | 0.071
5peptides
spectra
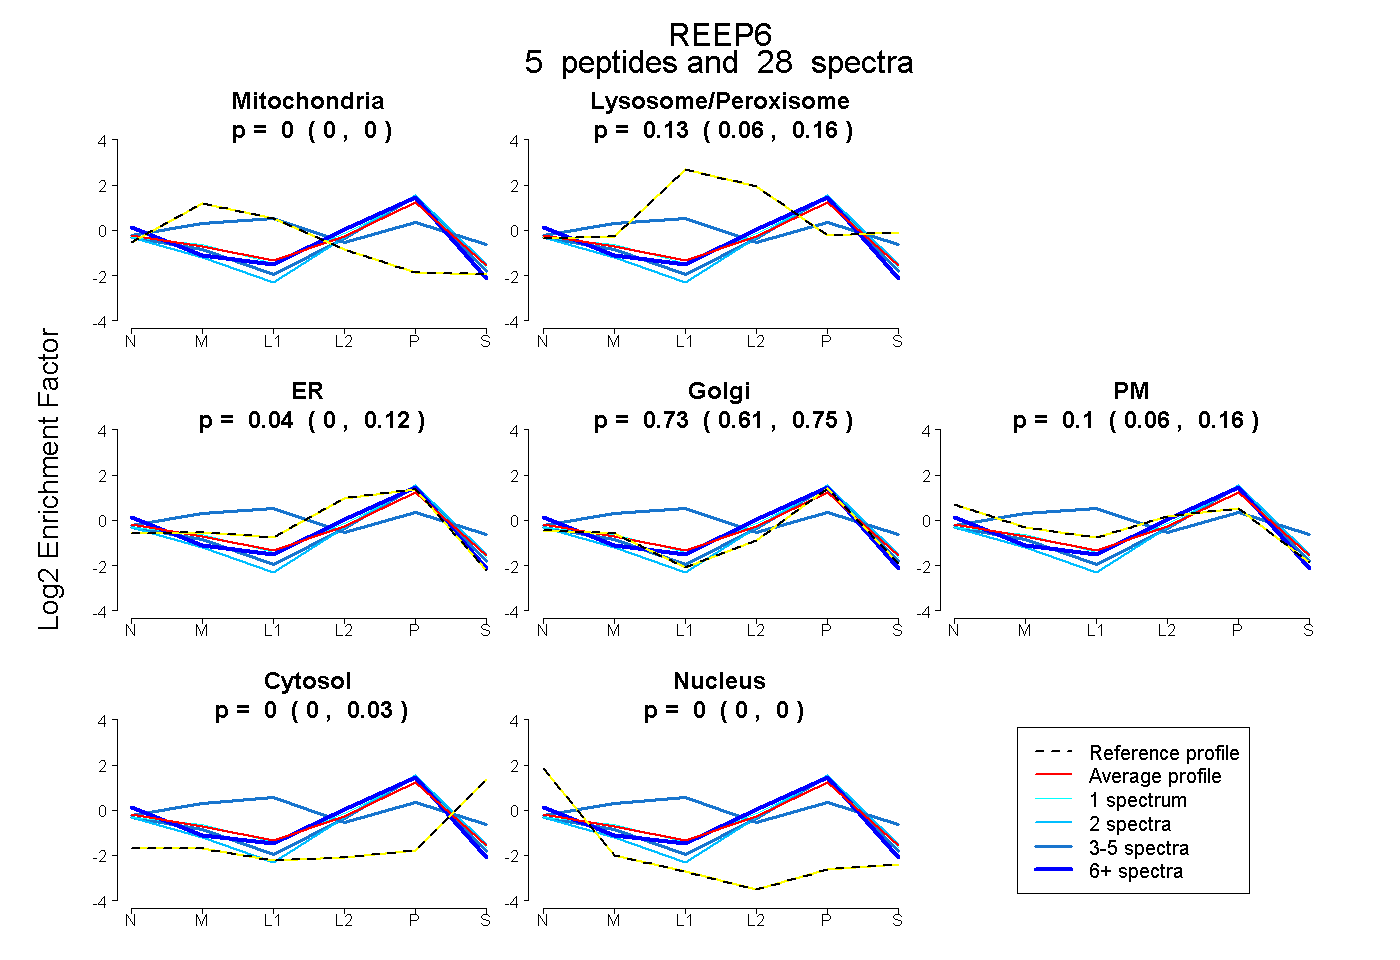
0.000 | 0.000
0.063 | 0.163
0.000 | 0.119
0.614 | 0.754
0.062 | 0.155
0.000 | 0.032
0.000 | 0.000