 6
6peptides
spectra
0.000 | 0.000
0.000 | 0.000
0.000 | 0.000
0.267 | 0.299
0.563 | 0.599
0.000 | 0.005
0.051 | 0.083
0.055 | 0.071
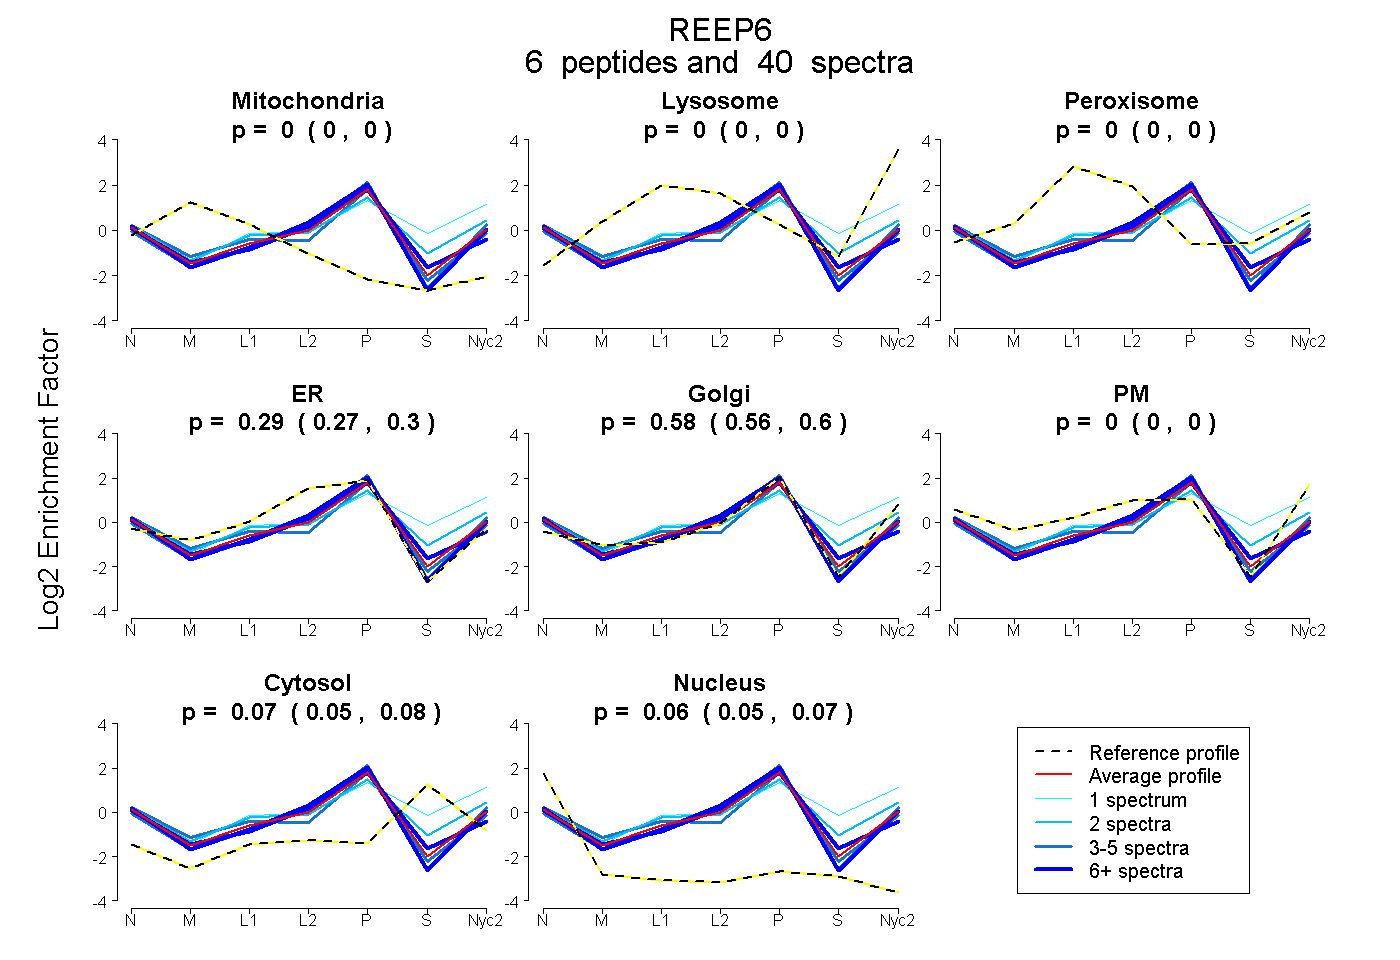
| Plot | Mito | Lyso | Perox | ER | Golgi | PM | Cytosol | Nucleus | |||||
| Expt A |
6 peptides |
40 spectra |
|
0.000 0.000 | 0.000 |
0.000 0.000 | 0.000 |
0.000 0.000 | 0.000 |
0.285 0.267 | 0.299 |
0.583 0.563 | 0.599 |
0.000 0.000 | 0.005 |
0.068 0.051 | 0.083 |
0.064 0.055 | 0.071 |
| 2 spectra, HHVALDSAASQLSGR | 0.000 | 0.000 | 0.066 | 0.046 | 0.484 | 0.192 | 0.213 | 0.000 | ||
| 4 spectra, DVLQALAR | 0.000 | 0.000 | 0.000 | 0.207 | 0.735 | 0.000 | 0.000 | 0.058 | ||
| 6 spectra, NVATDALGALEAR | 0.000 | 0.000 | 0.000 | 0.383 | 0.417 | 0.000 | 0.132 | 0.068 | ||
| 5 spectra, ALDIAAGITR | 0.000 | 0.000 | 0.044 | 0.153 | 0.688 | 0.000 | 0.000 | 0.115 | ||
| 1 spectrum, AIESPNK | 0.000 | 0.126 | 0.000 | 0.000 | 0.301 | 0.257 | 0.316 | 0.000 | ||
| 22 spectra, VIRPIFLK | 0.000 | 0.000 | 0.000 | 0.358 | 0.561 | 0.000 | 0.000 | 0.081 |
| Plot | Mito | Lyso or Perox | ER | Golgi | PM | Cytosol | Nucleus | ||||||
| Expt B |
5 peptides |
28 spectra |
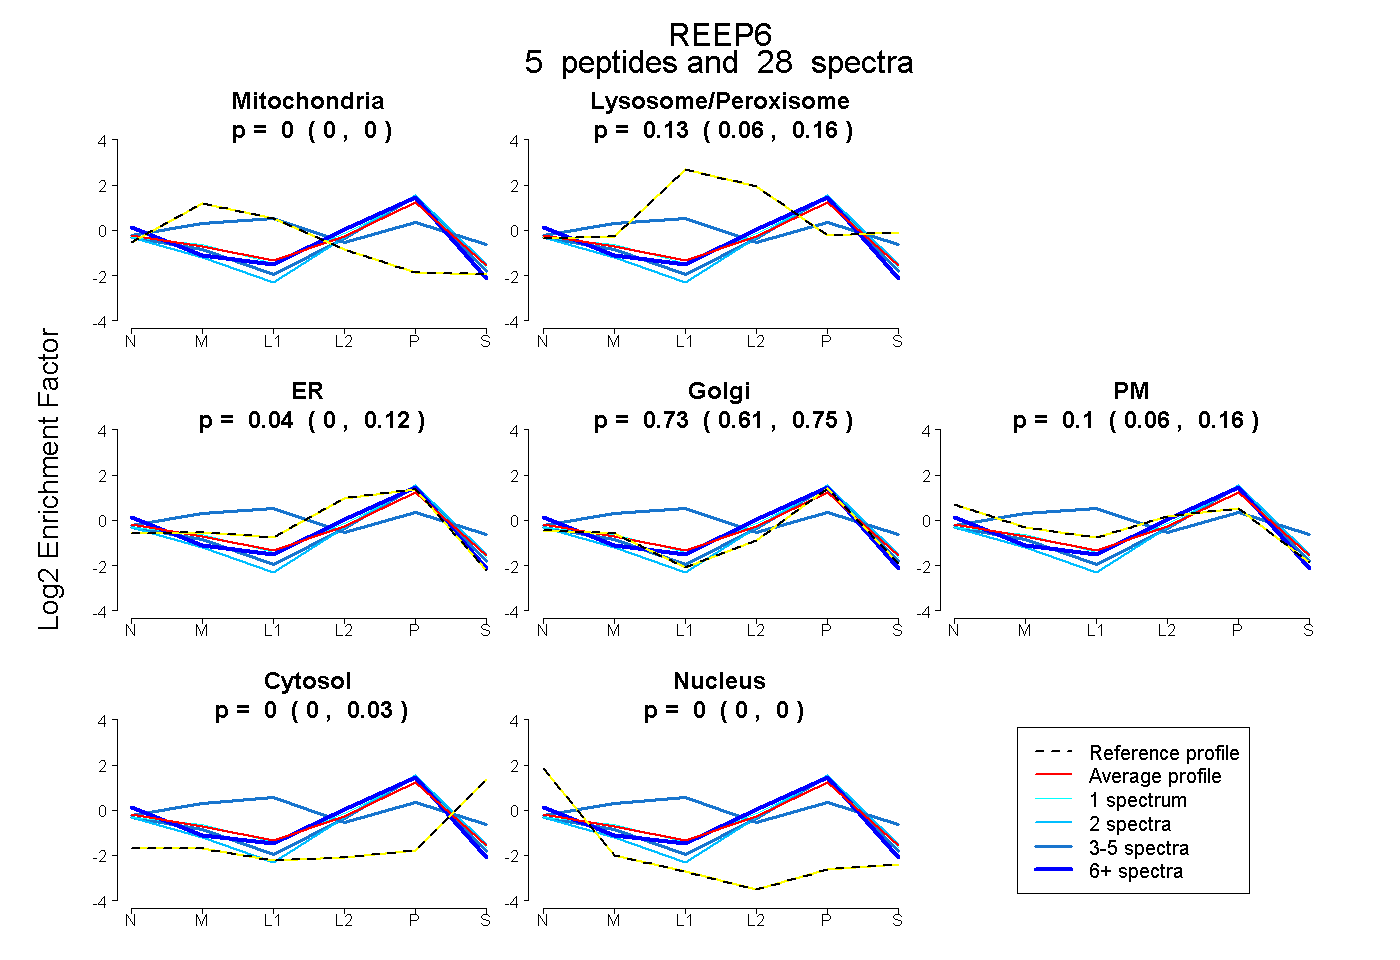 |
0.000 0.000 | 0.000 |
0.131 0.063 | 0.163 |
0.037 0.000 | 0.119 |
0.728 0.614 | 0.754 |
0.104 0.062 | 0.155 |
0.000 0.000 | 0.032 |
0.000 0.000 | 0.000 |
|||
| Plot | Lyso | Other | |||||||||||
| Expt C |
3 peptides |
8 spectra |
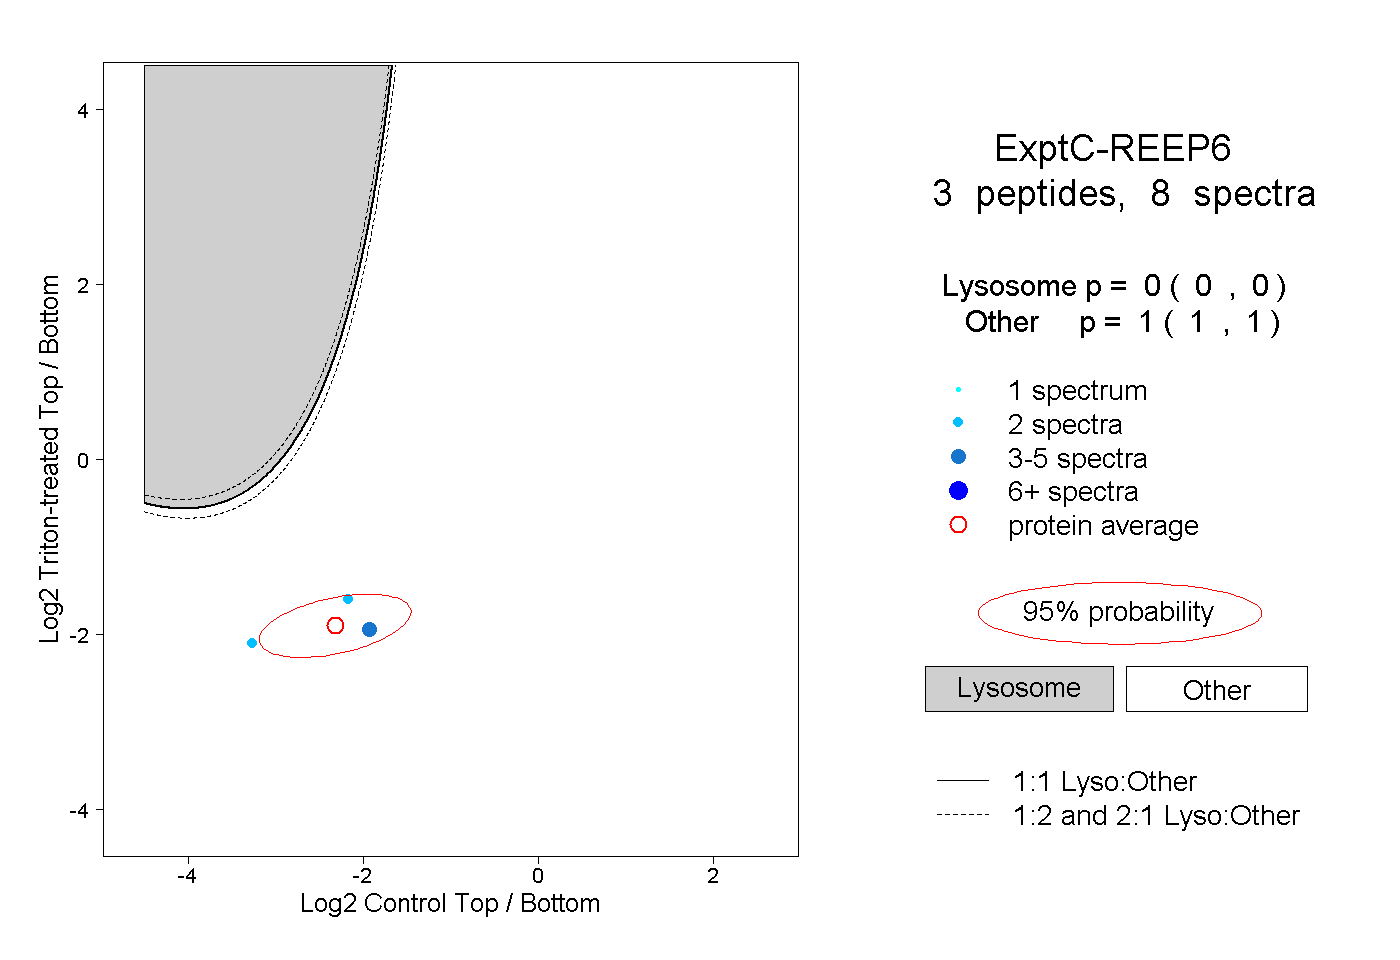 |
0.000 0.000 | 0.000 |
1.000 1.000 | 1.000 |
||||||||
| Plot | Lyso | Other | |||||||||||
| Expt D |
3 peptides |
5 spectra |
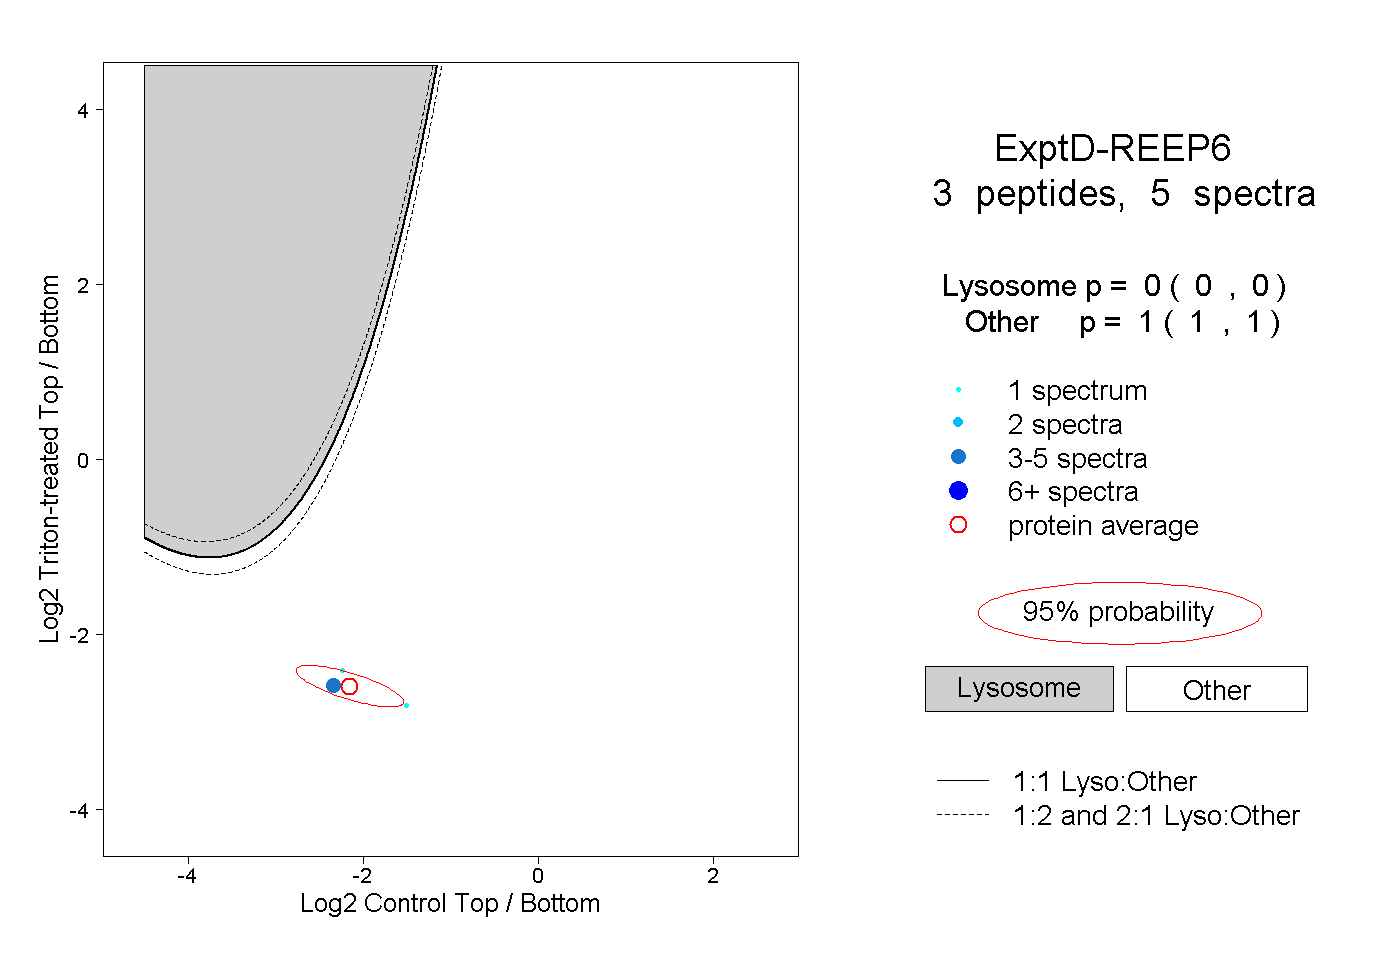 |
0.000 0.000 | 0.000 |
1.000 1.000 | 1.000 |