20
20peptides
spectra
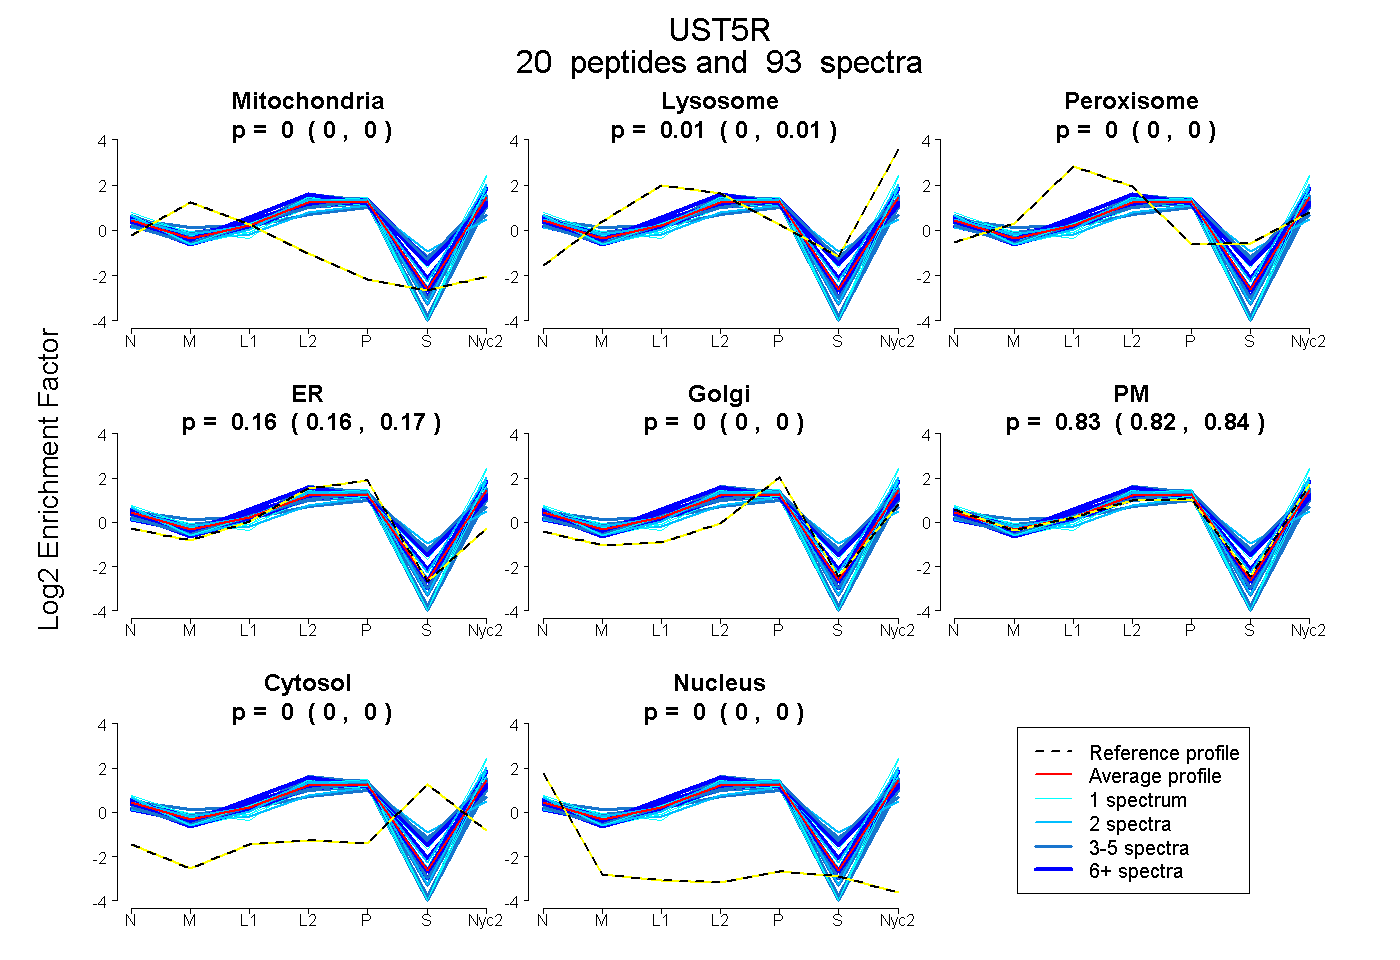
0.000 | 0.000
0.000 | 0.010
0.000 | 0.000
0.158 | 0.171
0.000 | 0.000
0.821 | 0.837
0.000 | 0.000
0.000 | 0.000
5peptides
spectra
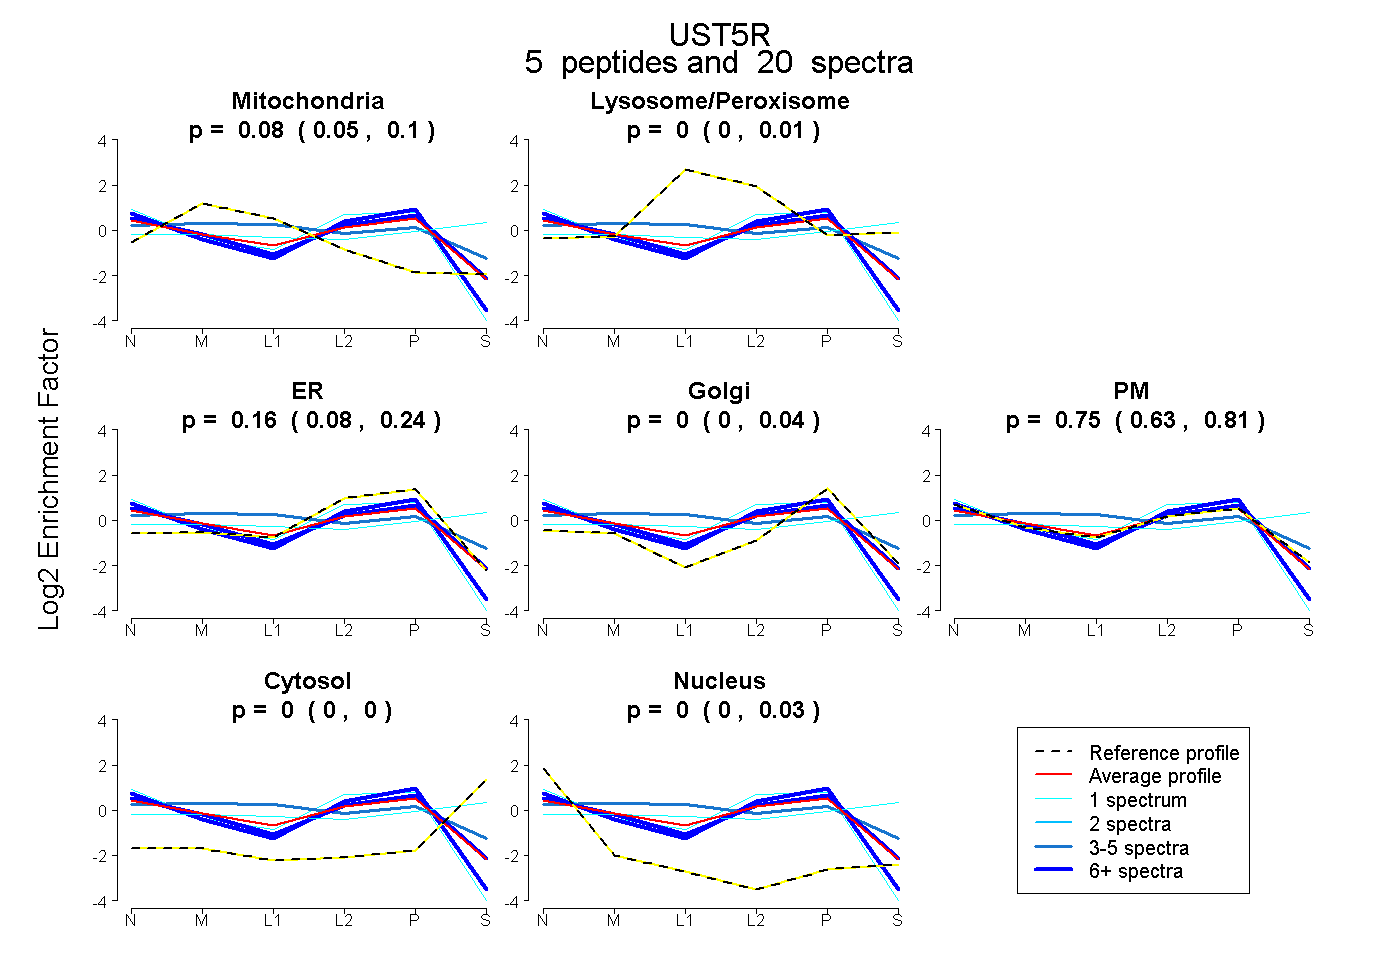
0.054 | 0.103
0.000 | 0.010
0.082 | 0.236
0.000 | 0.043
0.631 | 0.814
0.000 | 0.000
0.000 | 0.027
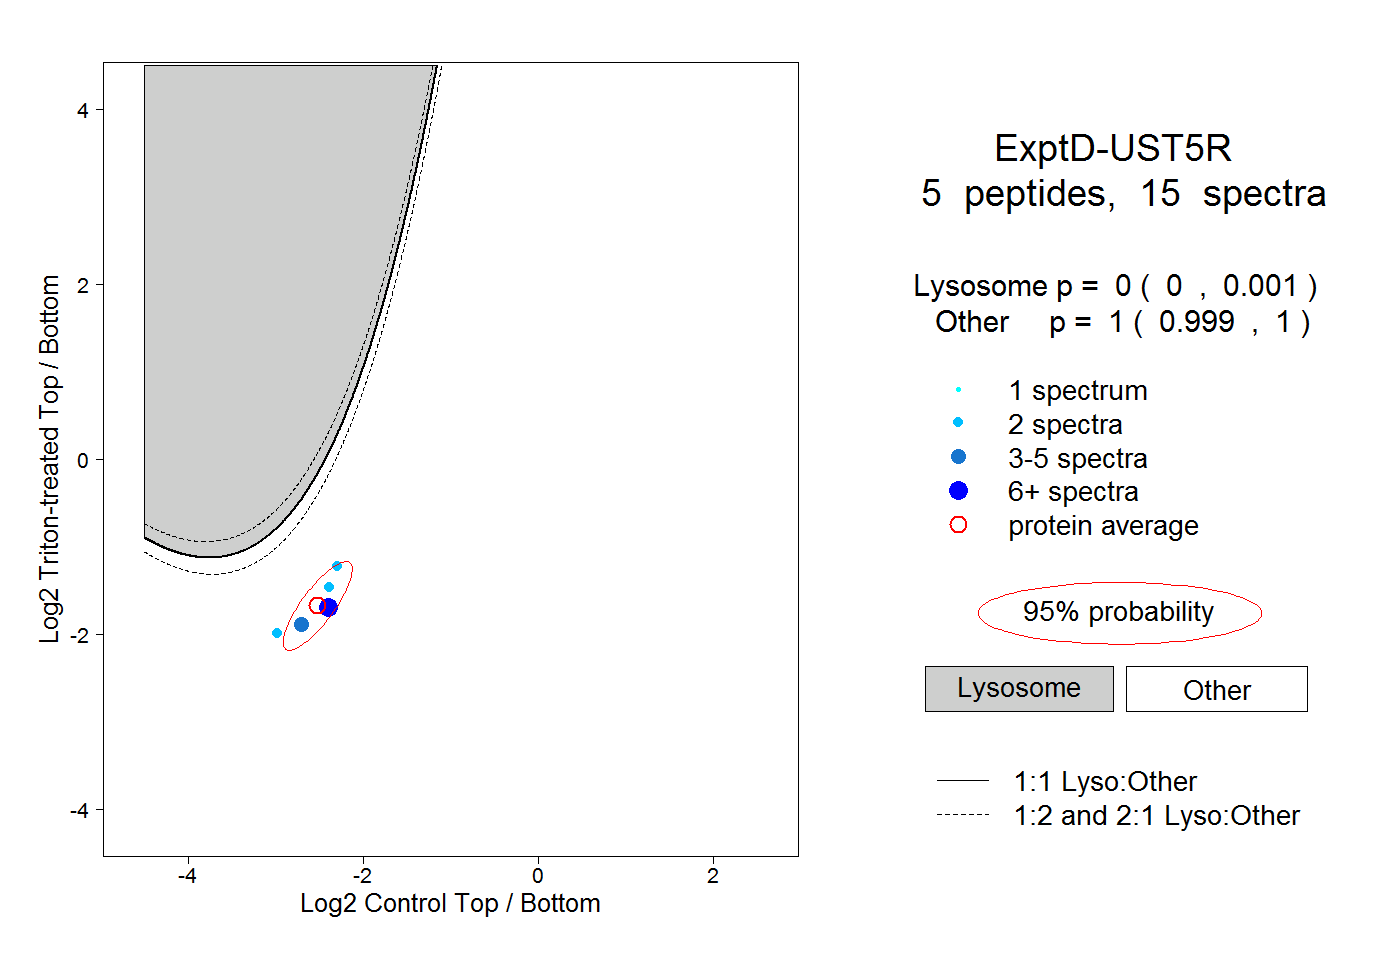
16peptides
spectra
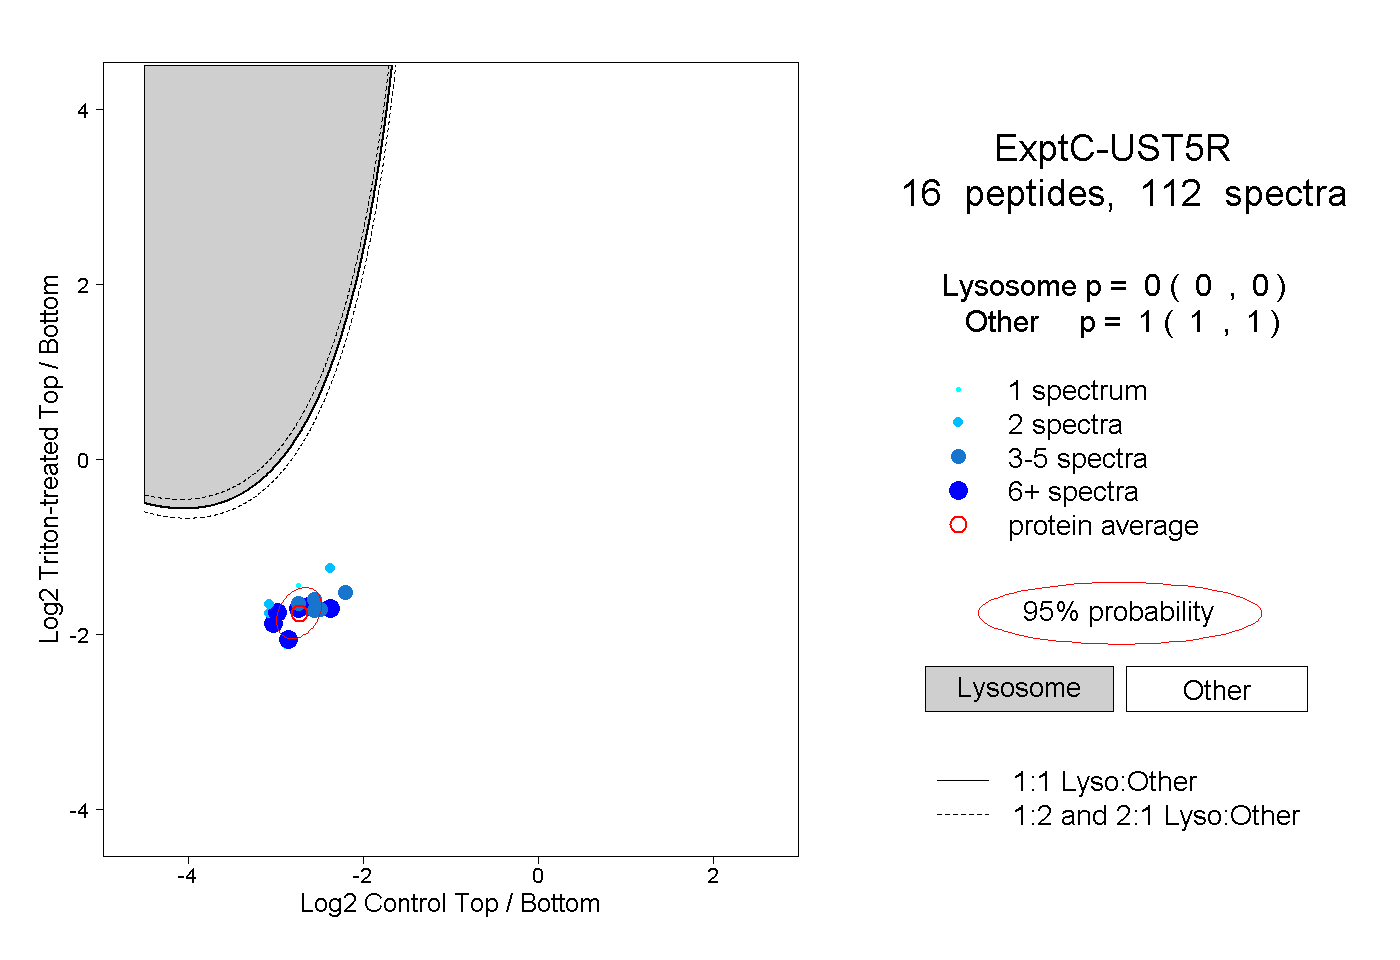
0.000 | 0.000
1.000 | 1.000