 20
20peptides
spectra
0.000 | 0.000
0.000 | 0.010
0.000 | 0.000
0.158 | 0.171
0.000 | 0.000
0.821 | 0.837
0.000 | 0.000
0.000 | 0.000
| Plot | Mito | Lyso | Perox | ER | Golgi | PM | Cytosol | Nucleus | |||||
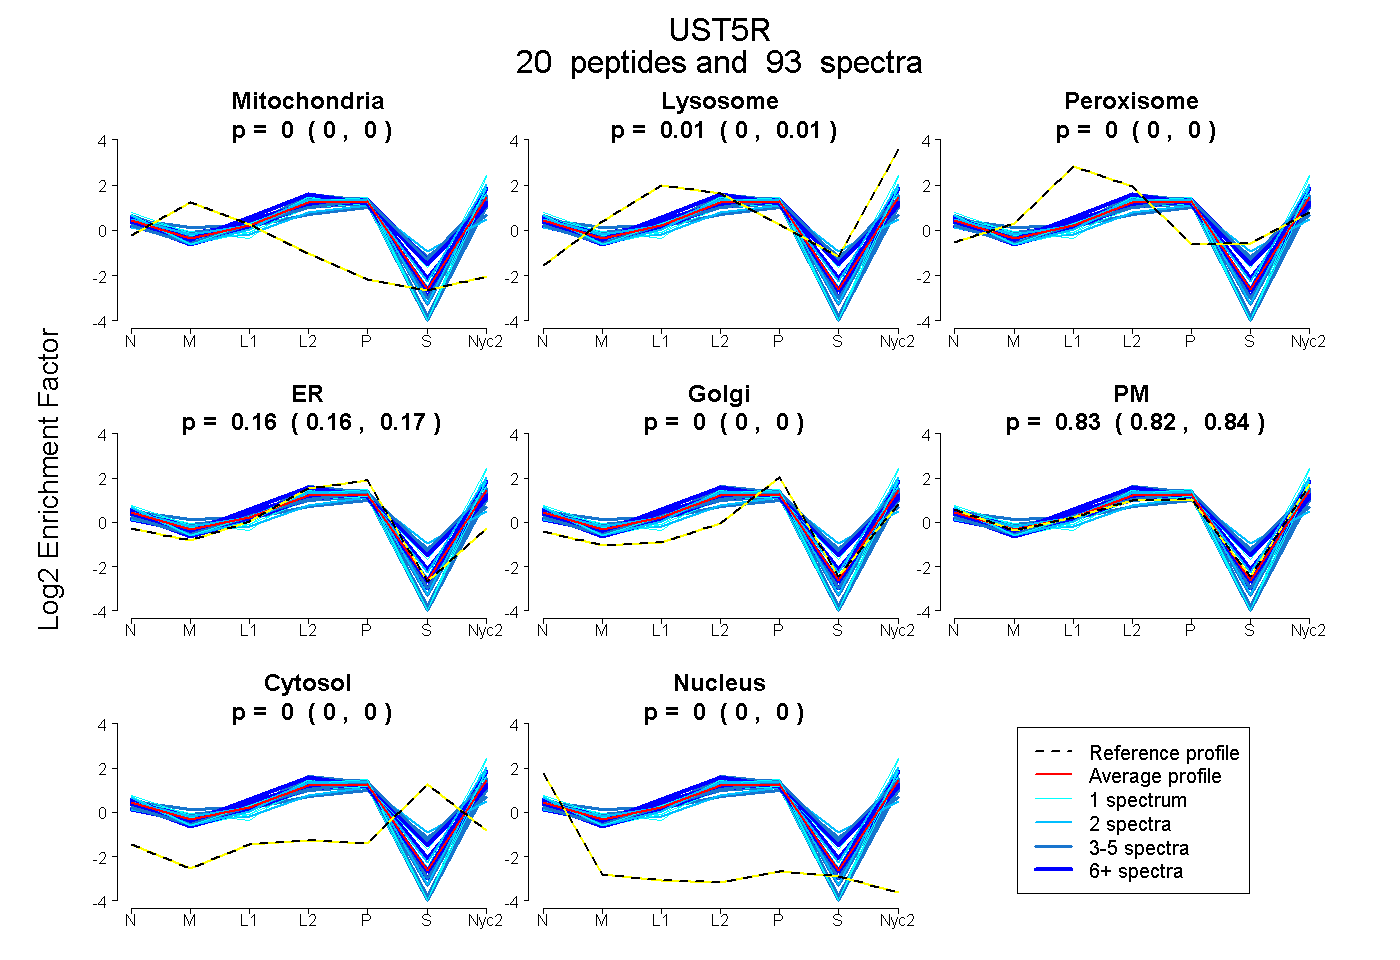
| Expt A |
20 peptides |
93 spectra |
|
0.000 0.000 | 0.000 |
0.006 0.000 | 0.010 |
0.000 0.000 | 0.000 |
0.165 0.158 | 0.171 |
0.000 0.000 | 0.000 |
0.830 0.821 | 0.837 |
0.000 0.000 | 0.000 |
0.000 0.000 | 0.000 |
| 1 spectrum, ITQMVIMFLR | 0.000 | 0.000 | 0.000 | 0.000 | 0.000 | 1.000 | 0.000 | 0.000 | ||
| 2 spectra, VAHMNGMK | 0.000 | 0.000 | 0.000 | 0.066 | 0.000 | 0.934 | 0.000 | 0.000 | ||
| 22 spectra, ISIPLDSHLR | 0.000 | 0.000 | 0.026 | 0.214 | 0.000 | 0.725 | 0.035 | 0.000 | ||
| 15 spectra, DLFHTPILR | 0.007 | 0.000 | 0.000 | 0.163 | 0.000 | 0.830 | 0.000 | 0.000 | ||
| 1 spectrum, LHTNELLPTTLR | 0.000 | 0.000 | 0.000 | 0.146 | 0.000 | 0.854 | 0.000 | 0.000 | ||
| 1 spectrum, ITQMVVMTLR | 0.000 | 0.085 | 0.000 | 0.000 | 0.000 | 0.915 | 0.000 | 0.000 | ||
| 4 spectra, ILNQDK | 0.000 | 0.000 | 0.000 | 0.244 | 0.000 | 0.756 | 0.000 | 0.000 | ||
| 3 spectra, VAHINGMK | 0.000 | 0.099 | 0.084 | 0.066 | 0.156 | 0.523 | 0.074 | 0.000 | ||
| 7 spectra, MRPSPR | 0.000 | 0.076 | 0.160 | 0.148 | 0.151 | 0.426 | 0.040 | 0.000 | ||
| 1 spectrum, QIYILSFIR | 0.000 | 0.000 | 0.000 | 0.000 | 0.000 | 0.915 | 0.085 | 0.000 | ||
| 8 spectra, SGDNITMEVVR | 0.000 | 0.043 | 0.028 | 0.177 | 0.000 | 0.654 | 0.098 | 0.000 | ||
| 1 spectrum, WLIVINKPQK | 0.000 | 0.000 | 0.000 | 0.049 | 0.000 | 0.951 | 0.000 | 0.000 | ||
| 3 spectra, AFQELLNQVGGLGR | 0.000 | 0.000 | 0.000 | 0.237 | 0.000 | 0.763 | 0.000 | 0.000 | ||
| 4 spectra, ELEAAK | 0.078 | 0.000 | 0.000 | 0.217 | 0.000 | 0.705 | 0.000 | 0.000 | ||
| 3 spectra, AFQELLNQVGSLGR | 0.000 | 0.000 | 0.000 | 0.156 | 0.000 | 0.844 | 0.000 | 0.000 | ||
| 2 spectra, WLSESAR | 0.000 | 0.100 | 0.000 | 0.000 | 0.000 | 0.900 | 0.000 | 0.000 | ||
| 4 spectra, EDPIIK | 0.000 | 0.000 | 0.000 | 0.350 | 0.000 | 0.650 | 0.000 | 0.000 | ||
| 2 spectra, NNPLPDCTHDVENDWK | 0.000 | 0.000 | 0.122 | 0.219 | 0.117 | 0.355 | 0.187 | 0.000 | ||
| 6 spectra, NSGDNLTMEVVR | 0.000 | 0.076 | 0.000 | 0.066 | 0.000 | 0.859 | 0.000 | 0.000 | ||
| 3 spectra, ILDQDK | 0.018 | 0.000 | 0.241 | 0.053 | 0.269 | 0.324 | 0.095 | 0.000 |
| Plot | Mito | Lyso or Perox | ER | Golgi | PM | Cytosol | Nucleus | ||||||
| Expt B |
5 peptides |
20 spectra |
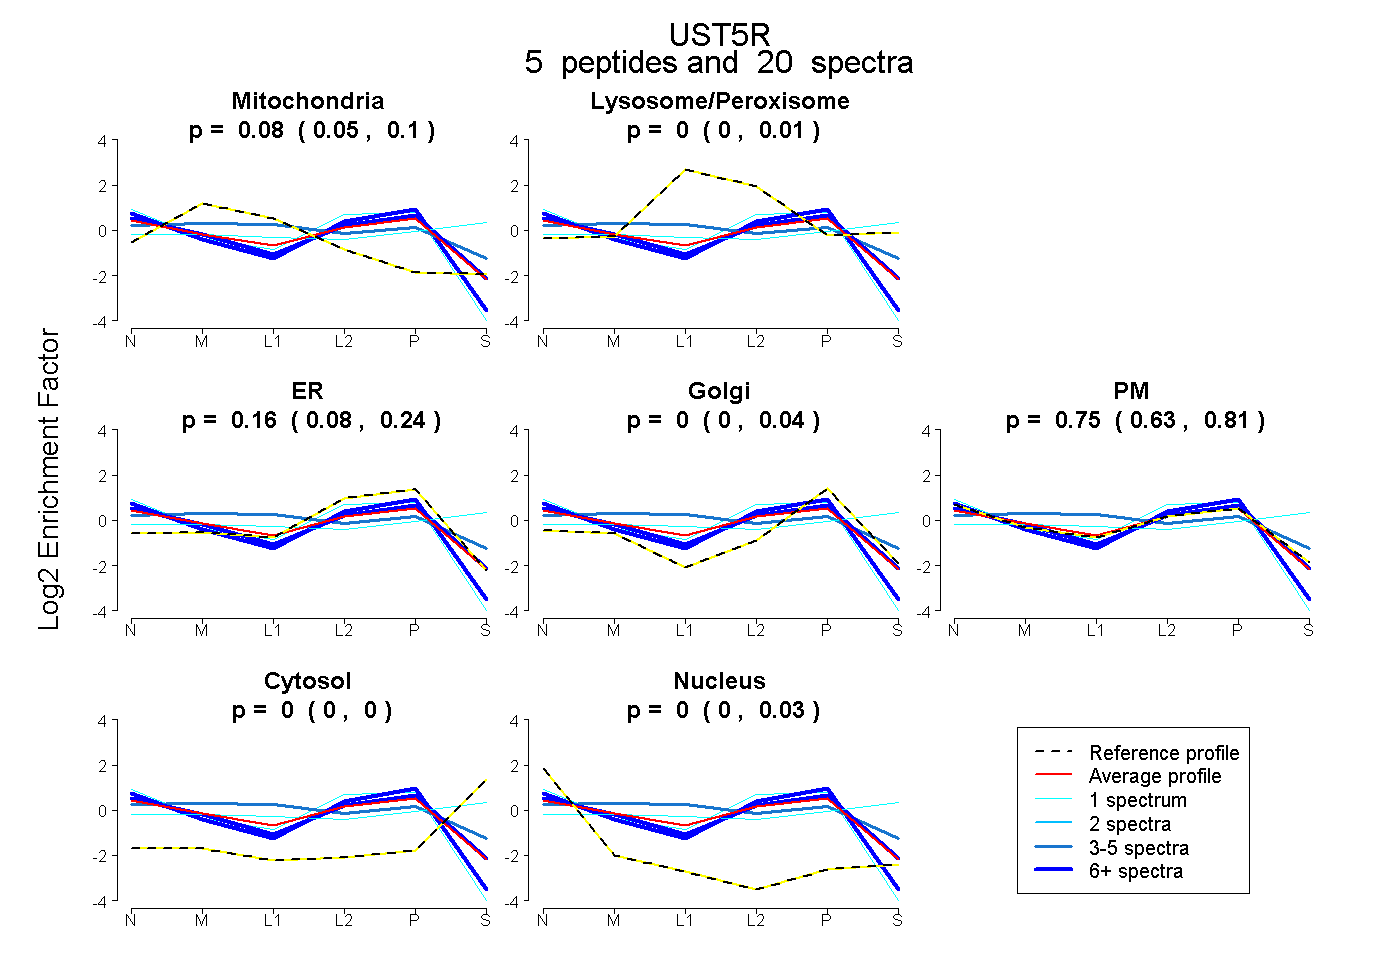 |
0.081 0.054 | 0.103 |
0.000 0.000 | 0.010 |
0.161 0.082 | 0.236 |
0.000 0.000 | 0.043 |
0.755 0.631 | 0.814 |
0.000 0.000 | 0.000 |
0.003 0.000 | 0.027 |
|||
| Plot | Lyso | Other | |||||||||||
| Expt C |
16 peptides |
112 spectra |
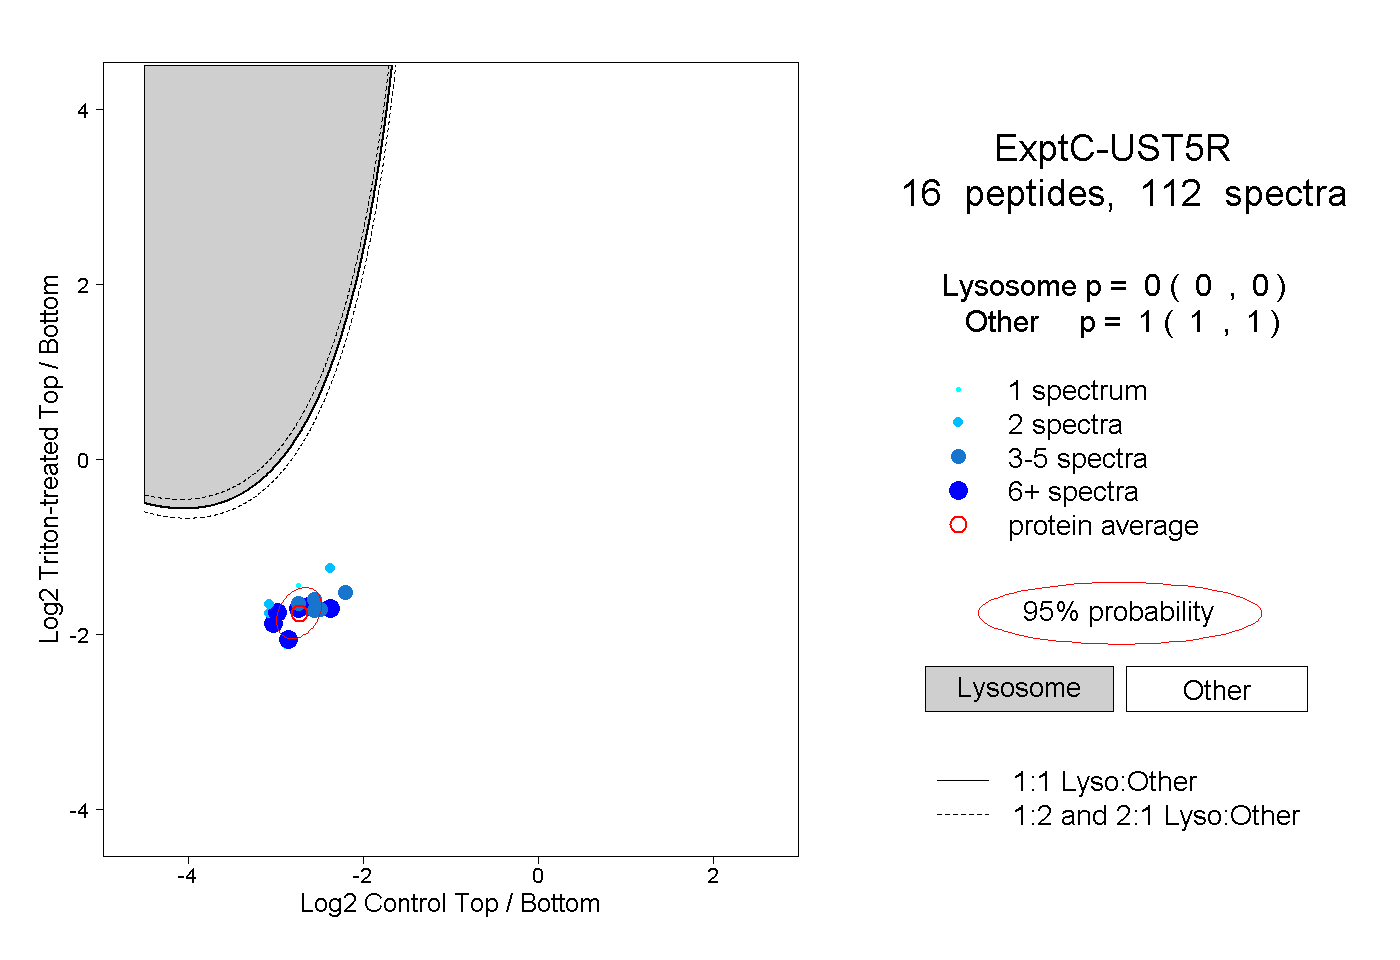 |
0.000 0.000 | 0.000 |
1.000 1.000 | 1.000 |
||||||||
| Plot | Lyso | Other | |||||||||||
| Expt D |
5 peptides |
15 spectra |
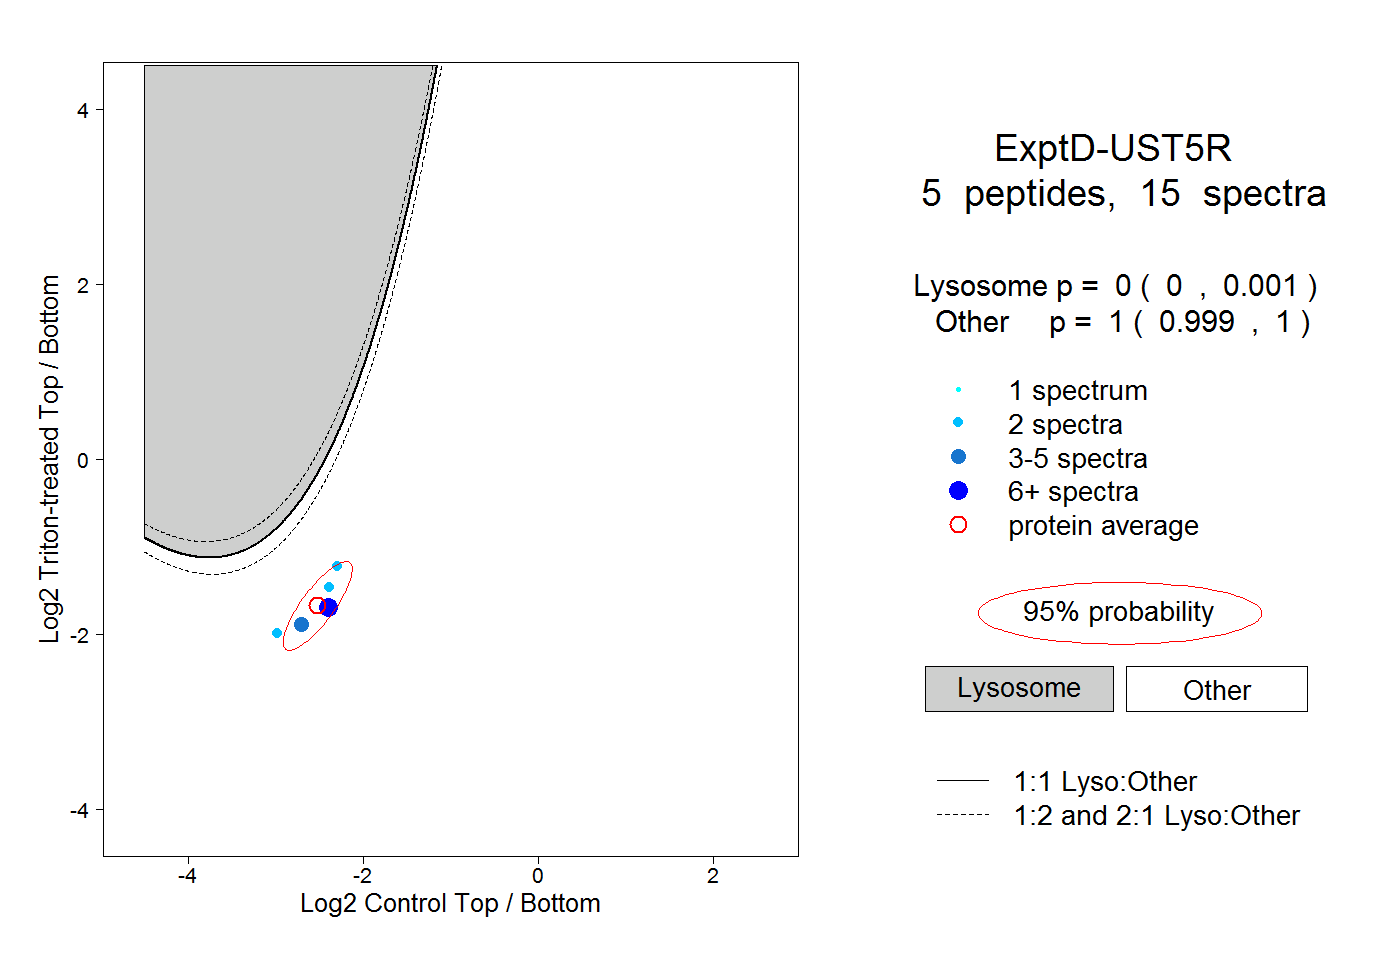 |
0.000 0.000 | 0.001 |
1.000 0.999 | 1.000 |