 7
7peptides
spectra
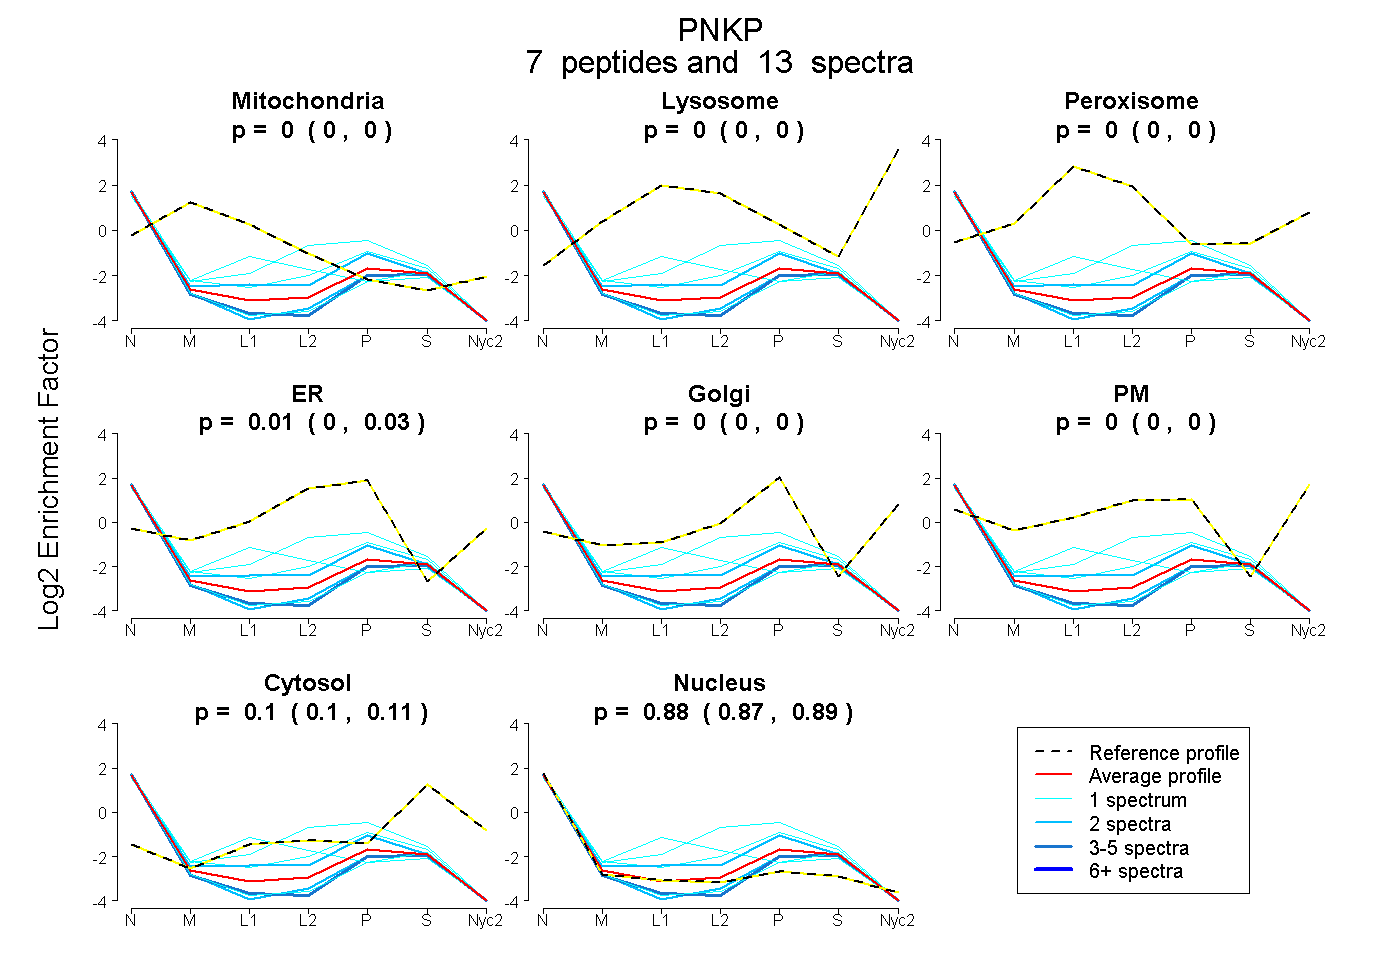
0.000 | 0.000
0.000 | 0.000
0.000 | 0.000
0.000 | 0.026
0.000 | 0.000
0.000 | 0.000
0.095 | 0.110
0.873 | 0.894
2peptides
spectra
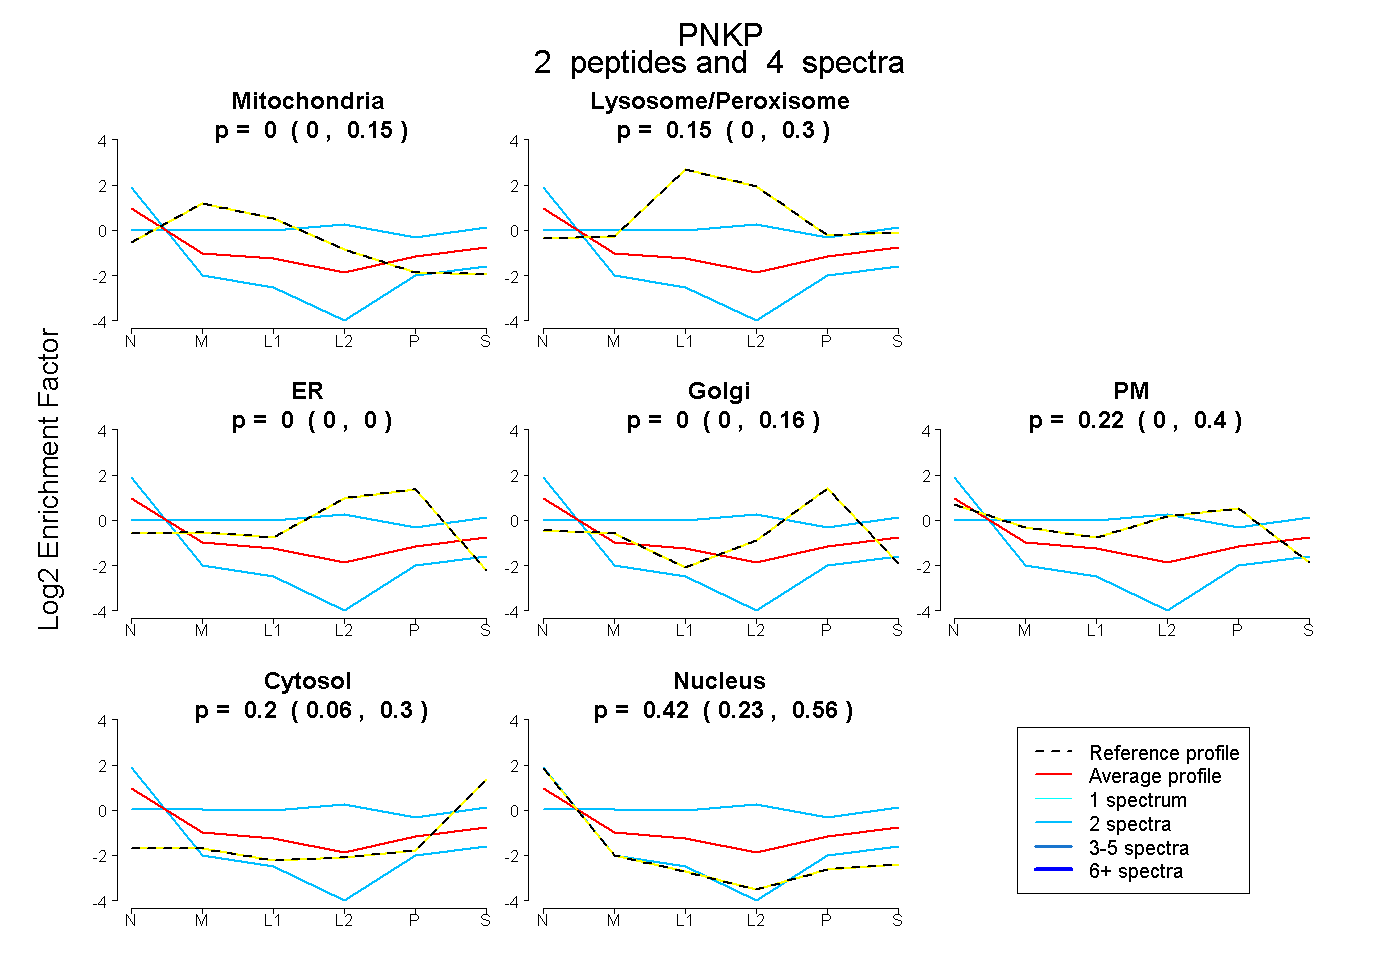
0.000 | 0.151
0.000 | 0.300
0.000 | 0.000
0.000 | 0.164
0.000 | 0.400
0.063 | 0.303
0.230 | 0.556